Momentum Family Face-Off: TRIX, MACD, Awesome, ROC, Momentum and the Volume Pretenders
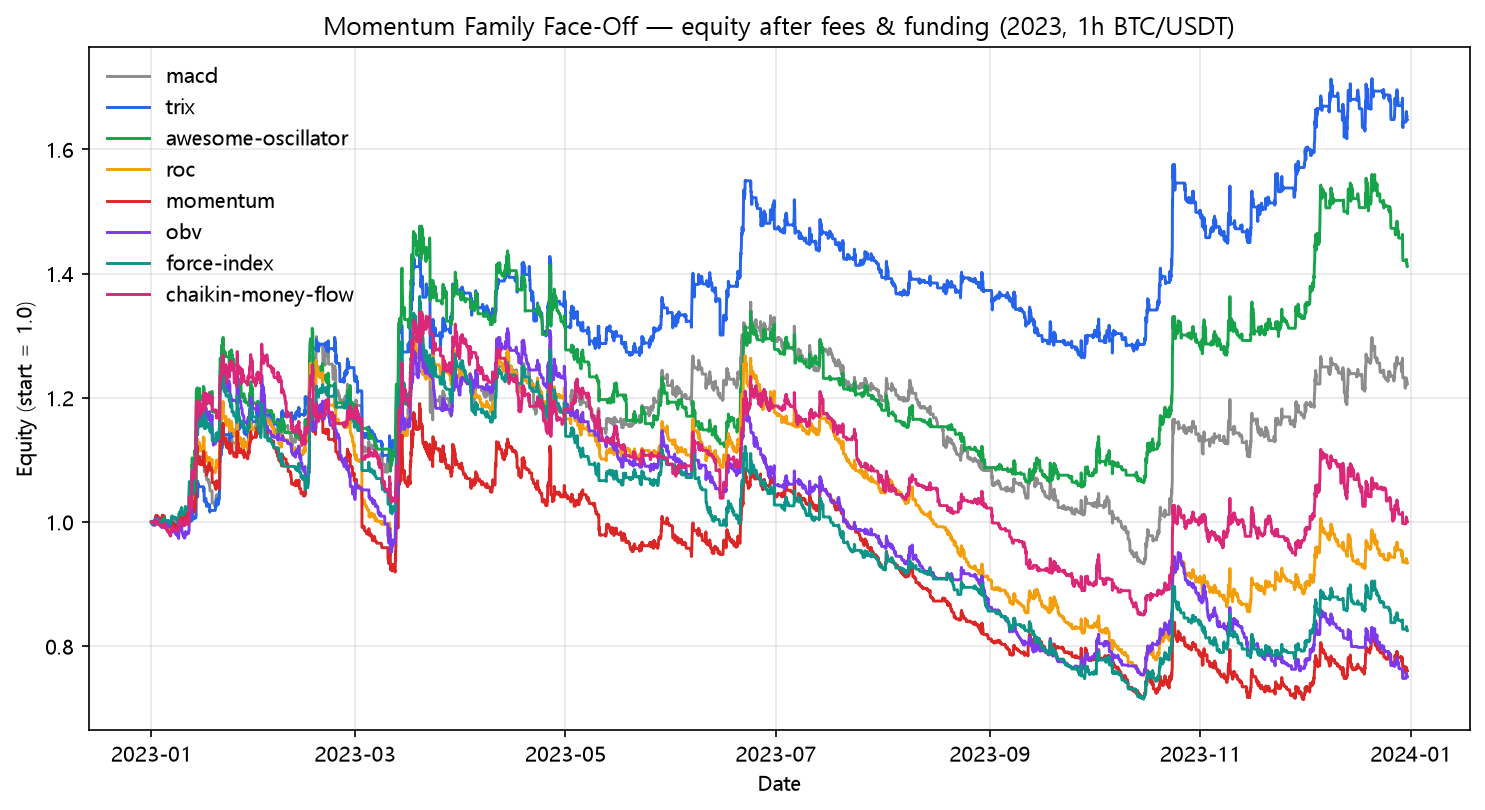
Eight momentum strategies on the same hourly BTC/USDT 2023: TRIX wins +64.74% net, MACD +22.21%. The rest — ROC, momentum, OBV, Force Index, CMF — all go negative after costs. Not one survives 25bp. Full table.
Momentum Family Face-Off: TRIX, MACD, Awesome, ROC, Momentum and the Volume Pretenders
The momentum family is the largest single rule family in the lab after trend, and the most heterogeneous: price-rate rules (ROC, momentum), smoothed-cross rules (MACD, TRIX), a medians rule (Awesome), and three volume-weighted pretenders (OBV, Force Index, CMF). Same data, same engine, same costs. The face-off. Strategy Lab #40.
The bracket
- MACD (post 15): 12/26/9 EMA convergence — 333 trades.
- TRIX (post 32): triple-EMA rate of change, 15/9 — 201 trades.
- Awesome Oscillator (post 34): 5/34 median SMA diff — 216 trades.
- ROC (post 31): close vs 12 bars ago — 700 trades.
- Momentum (post 35): close vs 10 bars ago — 785 trades.
- OBV (post 16): OBV above its 20 EMA — 734 trades.
- Force Index (post 33): price change × volume, 13 — 507 trades.
- CMF (post 36): 20-bar Chaikin Money Flow — 557 trades.
The results
| # | Strategy | Post | Naive | Fees+funding | 25bp | Trades | |---|---:|---:|---:|---:|---:| | 15 | MACD crossover | macd | +79.08% | +22.21% | -76.89% | 333 | | 32 | TRIX (triple-EMA rate of change) | trix | +111.94% | +64.74% | -39.65% | 201 | | 34 | Awesome Oscillator (5/34 median SMA) | awesome-oscillator | +84.99% | +41.14% | -52.04% | 216 | | 31 | Rate of Change (close vs N bars ago) | roc | +97.20% | -6.61% | -97.19% | 700 | | 35 | Momentum (close vs 10 bars ago) | momentum | +74.31% | -24.00% | -98.51% | 785 | | 16 | OBV trend (OBV above its EMA) | obv | +63.78% | -24.95% | -98.10% | 734 | | 33 | Force Index (price-change x volume) | force-index | +43.34% | -17.50% | -93.47% | 507 | | 36 | Chaikin Money Flow (20-bar CFM) | chaikin-money-flow | +84.53% | -0.00% | -93.84% | 557 |
Winner: TRIX, and the losers all lost the same way
TRIX (post 32) is the only momentum rule that came anywhere close to the trend family's numbers: +111.94% naive, +64.74% net, -39.65% at 25bp. MACD +22.21% and Awesome +41.14% round out the positives — both cost-robust at face value but wiped out at 25bp. The other five all went negative after normal fees and funding.
Look at the trade counts of the losers: 700, 785, 734, 507, 557. The volume "momentum" rules — OBV, Force Index, CMF — all traded 500+ times because a volume average flips sign constantly, and all of them destroyed their gross edge. CMF's -0.00% (post 36) is the most honest number in the lab: it spent a year trading 557 times and returned exactly nothing. ROC (-6.61%) and Momentum (-24.00%) had no volume excuse — a raw price-change threshold just fires too often.
The family verdict
Net ranking: TRIX > Awesome > MACD > CMF(-0.00%) > ROC > Force Index > OBV > Momentum. Cost-resilience ranking: TRIX > Awesome > MACD > ROC > Momentum > Force Index > CMF > OBV. In both, the smooth triple-EMA rule wins and the sign-flipping rules lose. The momentum family is the loudest demonstration of the lab's main finding: the gross edge is real, the net edge belongs to whatever trades least. TRIX, like EMA crossover and EMA envelope before it, won by being slow, not clever.
Code
import pandas as pd
from backtest_base import backtest_signal, metrics
from strategy import STRATEGIES

df = pd.read_pickle("assets/data/binance_BTCUSDT_1h_2023-01-01_2023-12-31.pkl")
mom = ["macd", "trix", "awesome", "roc", "momentum", "obv", "force_index", "cmf"]

for name in mom:
    spec = STRATEGIES[name]
    signal = spec["func"](df, **spec["params"])
    res = backtest_signal(df, signal, cost_per_leg=0.0005, funding_per_bar=0.0000125)
    m = metrics(res, 8760)
    print(f"{name:<14} {m['total_return']:+9.2%}  trades {m['trades']}")
Reproduce it
cd blog-drafts/scripts
python gen_special_assets.py   # regenerates this chart + all group tables
Data: Binance public API, hourly OHLCV, 8,735 bars. Every number above reproduces from the manifest + post.json of posts 15, 32, 34, 31, 35, 16, 33, 36.
This is a backtest on historical data, not investment advice. Past performance does not predict future results.