Chaikin Money Flow Backtest on BTC/USDT: The Volume Oscillator That Gave Everything Back
Chaikin Money Flow (CMF 20) on real hourly BTC/USDT 2023: +84.53% naive, -0.00% with fees and funding, -93.84% at 25bp across 557 trades. The roundest zero in the lab — a strategy that spent a +155% year returning exactly nothing.
Chaikin Money Flow Backtest on BTC/USDT (2023, hourly, real fees)
I ended the volume family with the strangest number of the whole lab: -0.00%. Not a typo, not a rounding error — after fees and funding, the Chaikin Money Flow strategy closed 2023 with a total return of negative zero. It spent a year trading 557 times on the strongest bull tape in crypto, entered and exited hundreds of positions, paid for all of it, and finished exactly where it started. A strategy that did nothing made +154.94%. I stared at the table for a while, and then I saved it, because -0.00% is the most honest number in this series. Strategy Lab #36.
The setup
CMF = sum of (money flow volume) over 20 bars / sum of volume, where each bar's money-flow volume is (high+low+close normalized) × volume. It's the volume-weighted sibling of the accumulation/distribution line — OBV's more careful cousin, which post 16 already ran and also failed. Long when CMF(20) > 0. The idea is fine; the frequency is the story: 557 flips of the sign of a 20-bar volume average.
Results
| Strategy | Category | Total return | CAGR | MaxDD | Sharpe | Trades |
|---|---|---|---|---|---|---|
| cmf | volume | -0.00% | -0.00% | -36.45% | 0.17 | 557 |
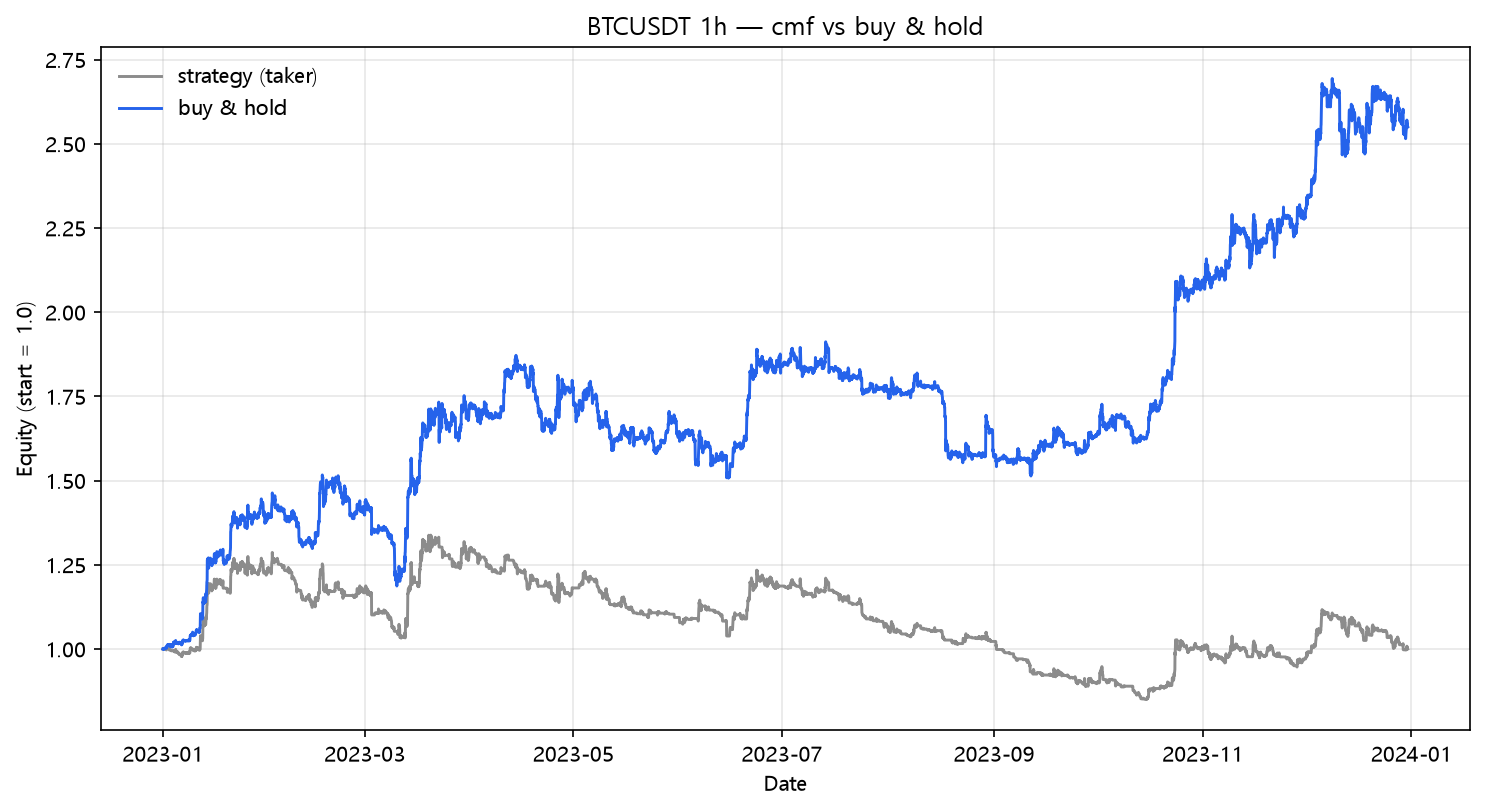
Naive CMF made +84.53% with a Sharpe of 1.98 — a table that would print beautifully. Then the costs start and the return falls through +5.76% (taker) to -0.00% (with funding). The equity curve in the funded chart is the definition of sideways: the strategy captured the trend, gave it back, captured it again, gave it back again, all year.
The fee bill
| Scenario | Cost/leg | Total return | MaxDD | Sharpe | Trades | |---|---:|---:|---:|---:|---:|---:| | naive (zero cost) | 0.00% | +84.53% | -18.44% | 1.98 | 557 | | taker fee 0.05%/leg | 0.05% | +5.76% | -34.62% | 0.33 | 557 | | + funding 0.01%/8h | 0.05% | -0.00% | -36.45% | 0.17 | 557 | | + slippage 10bp/leg | 0.15% | -67.18% | -72.81% | -3.09 | 557 | | + slippage 25bp/leg | 0.30% | -93.84% | -94.47% | -7.78 | 557 |
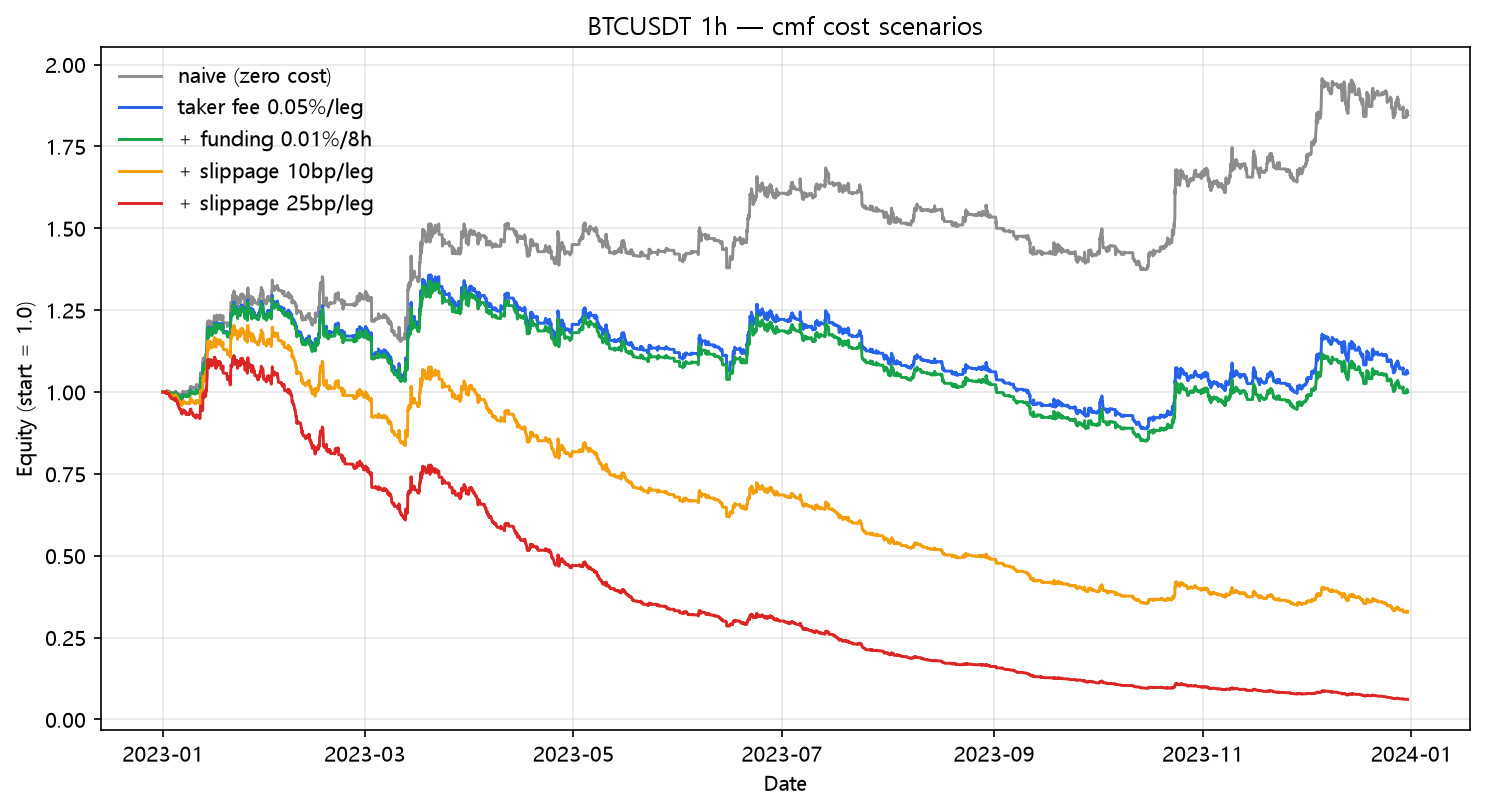
+84.53% → -93.84%. 1,113 legs at 25bp is 69.56% of the account per year. The win rate was 46.3% (258/557), and the shape is now a lab fixture: high churn, middling win rate, gross edge measured in tens of points, costs measured in dozens. The volume family verdict is now complete and unanimous — OBV (post 16) and CMF both failed, and CMF's failure has the best ending: a perfectly round zero.
The volume-family scoreboard (hourly BTC, 2023)
| Strategy | Trades | Naive | Fees+funding | 25bp |
|---|---|---|---|---|
| OBV (post 16) | 734 | +63.78% | -24.95% | -98.10% |
| MFI (post 29) | 36 | +18.87% | +9.01% | -8.98% |
| Force Index (post 33) | 507 | +43.34% | -17.50% | -93.47% |
| CMF (this) | 557 | +84.53% | -0.00% | -93.84% |
Every volume-weighted momentum rule in the lab fails the same way. The only volume strategy that survived costs — MFI — was the reversion one that traded 36 times. Same volume data, same cost model, same engine: the survival variable is always trade count.
What this does NOT prove
- CMF as a filter (e.g., "only take long setups while CMF > 0") is a legitimate use that this standalone test doesn't evaluate.
- 20 bars is the standard CMF lookback; a 50-bar CMF would flip less often. The lab's consistent finding suggests slower is better, but nothing here proves it.
- 2023's persistent trend is the exact weather where a sign-flipping volume rule underperforms a trend rule. A range year could rank CMF higher — I'd rather not bet on it.
Code
from backtest_base import fetch, backtest_signal, metrics

df = fetch("BTCUSDT", "binance", "2023-01-01", "2023-12-31", "1h")
h, l, c = df["high"], df["low"], df["close"]
mfm = ((c - l) - (h - c)) / (h - l).replace(0.0, np.nan)
mfv = mfm * df["volume"]
cmf = mfv.rolling(20).sum() / df["volume"].rolling(20).sum()

signal = (cmf > 0.0).fillna(False)
res = backtest_signal(df, signal, cost_per_leg=0.0005,
                      funding_per_bar=0.0001 / 8.0)
print(metrics(res, 8760))
Reproduce it
cd blog-drafts/scripts
python backtest_base.py --strategy cmf --symbol BTCUSDT --interval 1h \
    --start 2023-01-01 --end 2023-12-31 --fee 0.0005 --funding 0.0000125
Data: Binance public API, hourly OHLCV, 8,735 bars. The tables above reproduce exactly from this command.
This is a backtest on historical data, not investment advice. Past performance does not predict future results.