CCI Mean Reversion Backtest on BTC/USDT: The Only 70%+ Win Rate That Still Loses Under Slippage
Commodity Channel Index (CCI) mean reversion on real hourly BTC/USDT 2023: +41.15% naive, +20.00% with fees/funding, -33.22% at 25bp. 70.9% win rate, 117 trades — the exact profile that looks great and pays the exchange instead.
CCI Mean Reversion Backtest on BTC/USDT (2023, hourly, real fees)
The Commodity Channel Index, from Donald Lambert's 1980 Commodities magazine article, measures price position relative to its own average in volatility-adjusted units: (typical price − SMA) / (0.015 × mean deviation). Below −100 is "abnormally low," above +100 "abnormally high." The classic reversion trade is: buy below −100, sell when it recovers above +100. I ran that on hourly BTC/USDT and got a win rate of 70.9% — the highest in the lab — on a strategy that still gives all its money back to slippage. Strategy Lab #26.
The checklist
- Rule — enter when CCI(20) < −100, exit when CCI(20) > +100. Long only.
- Data — Binance BTCUSDT 1h, 2023, 8,735 bars.
- Cost model — the five standard scenarios.
- Hypothesis — mean reversion pays on hourly crypto if exits are patient; the −100/+100 band should filter shallow dips.
- Question — can a 70%+ win rate survive 234 legs of costs?
Results
| Strategy | Category | Total return | CAGR | MaxDD | Sharpe | Trades |
|---|---|---|---|---|---|---|
| cci | meanrev | +20.00% | +20.06% | -18.51% | 0.86 | 117 |
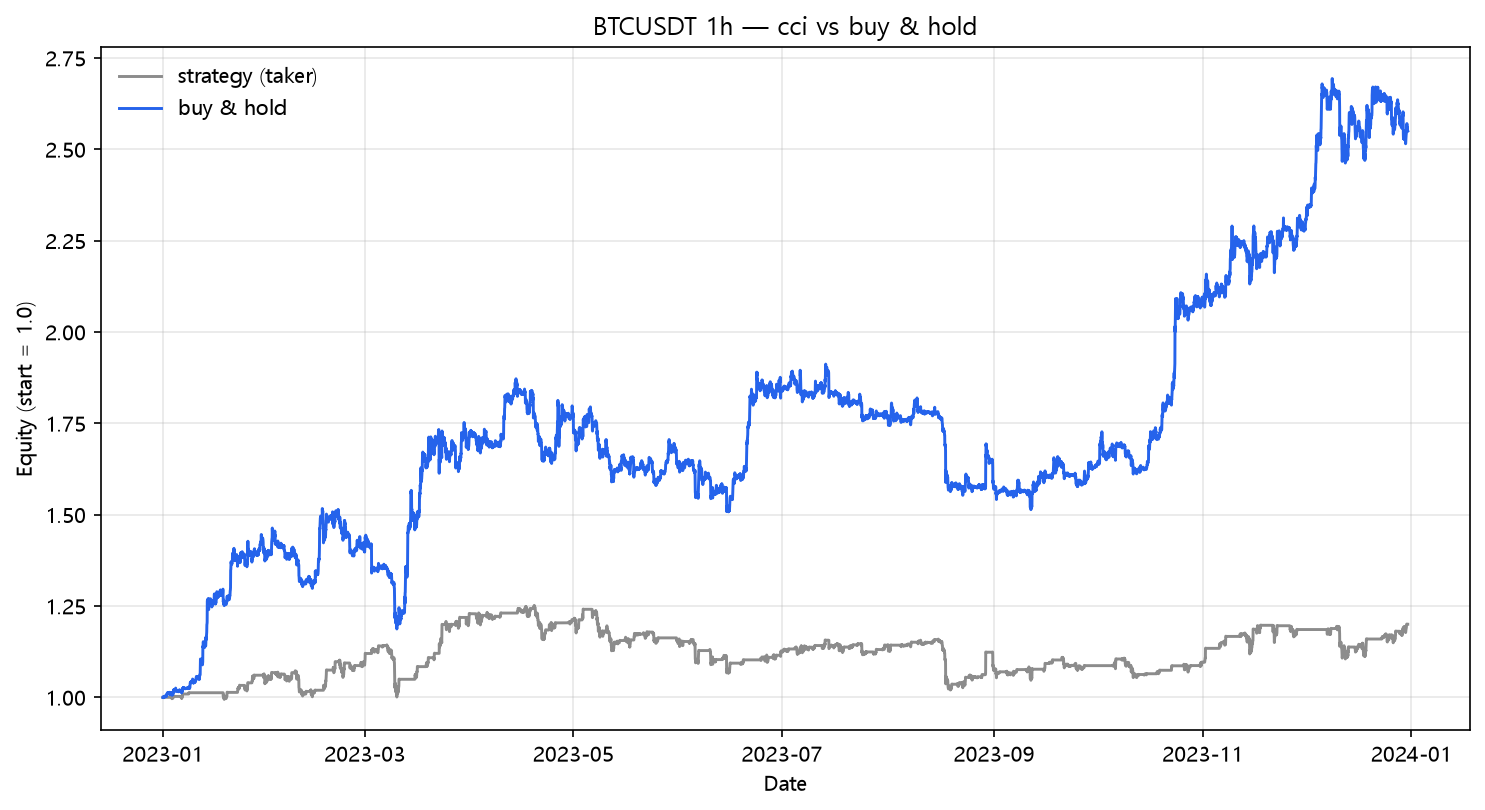
Naive: +41.15%. After fees and funding: +20.00%. The win rate — 83 of 117 round trips, 70.9% — is genuinely high, and it's the trap. A 70% win rate with modest average win size means the strategy depends on the fee-free world to make its margin. Take the standard haircut and the strategy is still positive at taker+fees, which is more than the RSI(2) reversion (post 08) managed — but the comparison ends there.
The fee bill
| Scenario | Cost/leg | Total return | MaxDD | Sharpe | Trades | |---|---:|---:|---:|---:|---:|---:| | naive (zero cost) | 0.00% | +41.15% | -13.46% | 1.51 | 117 | | taker fee 0.05%/leg | 0.05% | +25.56% | -17.02% | 1.04 | 117 | | + funding 0.01%/8h | 0.05% | +20.00% | -18.51% | 0.86 | 117 | | + slippage 10bp/leg | 0.15% | -5.06% | -25.48% | -0.08 | 117 | | + slippage 25bp/leg | 0.30% | -33.22% | -40.65% | -1.47 | 117 |
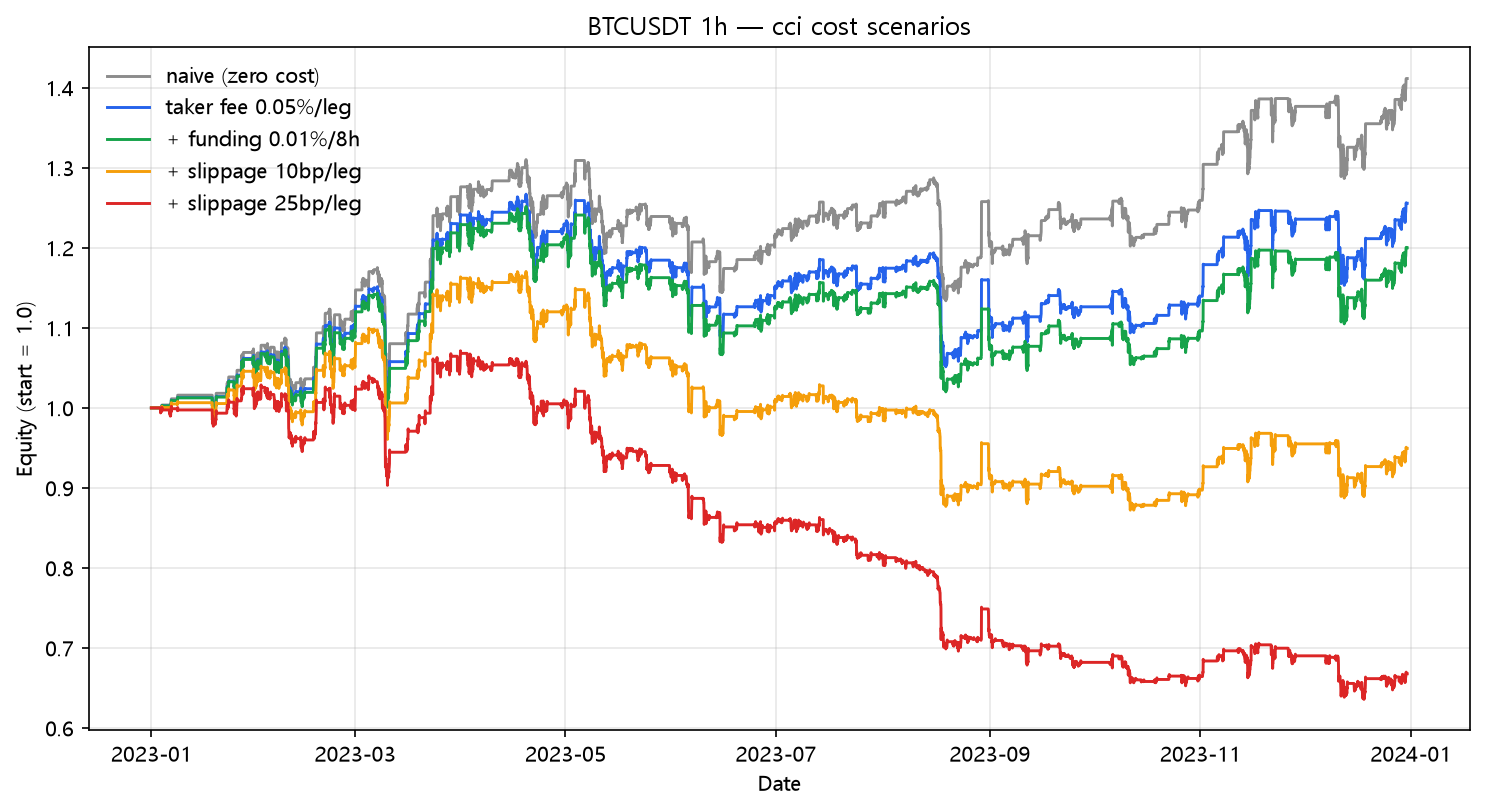
+41.15% → -33.22%. The point of this table isn't that CCI is bad — it's that mean reversion buys into bad liquidity by design. When price is below −100, you are buying while everyone else is selling; your fill is systematically worse than the candle close. That's the slippage the model assumes at 10 and 25bp, and it's exactly why the win rate is the wrong metric here. 70.9% of the time you're right by a little; the times you're wrong, the wrong fill is on the far side of a liquidity hole. Compare Aroon (post 23), a trend strategy with a similar frequency and the same lesson: win rate measures how often you're right, not whether it pays.
What this does NOT prove
- −100/+100 is the textbook pair; wider bands (+150/−150) trade less and would change the whole shape.
- CCI reversion on daily data is a genuinely different animal — this is the hourly punishment.
- One bullish year is the wrong weather to judge a reversion strategy that profits from range; its moment is a flat tape, and 2023 wasn't flat.
Code
from backtest_base import fetch, backtest_signal, metrics

df = fetch("BTCUSDT", "binance", "2023-01-01", "2023-12-31", "1h")
tp = (df["high"] + df["low"] + df["close"]) / 3.0
m  = tp.rolling(20).mean()
md = (tp - m).abs().rolling(20).mean()
cci = (tp - m) / (0.015 * md.replace(0.0, np.nan))

enter = (cci < -100.0).to_numpy()
exit_ = (cci > 100.0).to_numpy()
position = np.zeros(len(df), dtype=bool)
held = False
for i in range(len(df)):
    if not held and enter[i]:
        held = True
    elif held and exit_[i]:
        held = False
    position[i] = held

signal = pd.Series(position, index=df.index)
res = backtest_signal(df, signal, cost_per_leg=0.0005,
                      funding_per_bar=0.0001 / 8.0)
print(metrics(res, 8760))
Reproduce it
cd blog-drafts/scripts
python backtest_base.py --strategy cci --symbol BTCUSDT --interval 1h \
    --start 2023-01-01 --end 2023-12-31 --fee 0.0005 --funding 0.0000125
Data: Binance public API, hourly OHLCV, 8,735 bars. The tables above reproduce exactly from this command.
This is a backtest on historical data, not investment advice. Past performance does not predict future results.