CCI Trend Backtest on BTC/USDT: +85.98% Net — the Same Oscillator, Flipped 180 Degrees
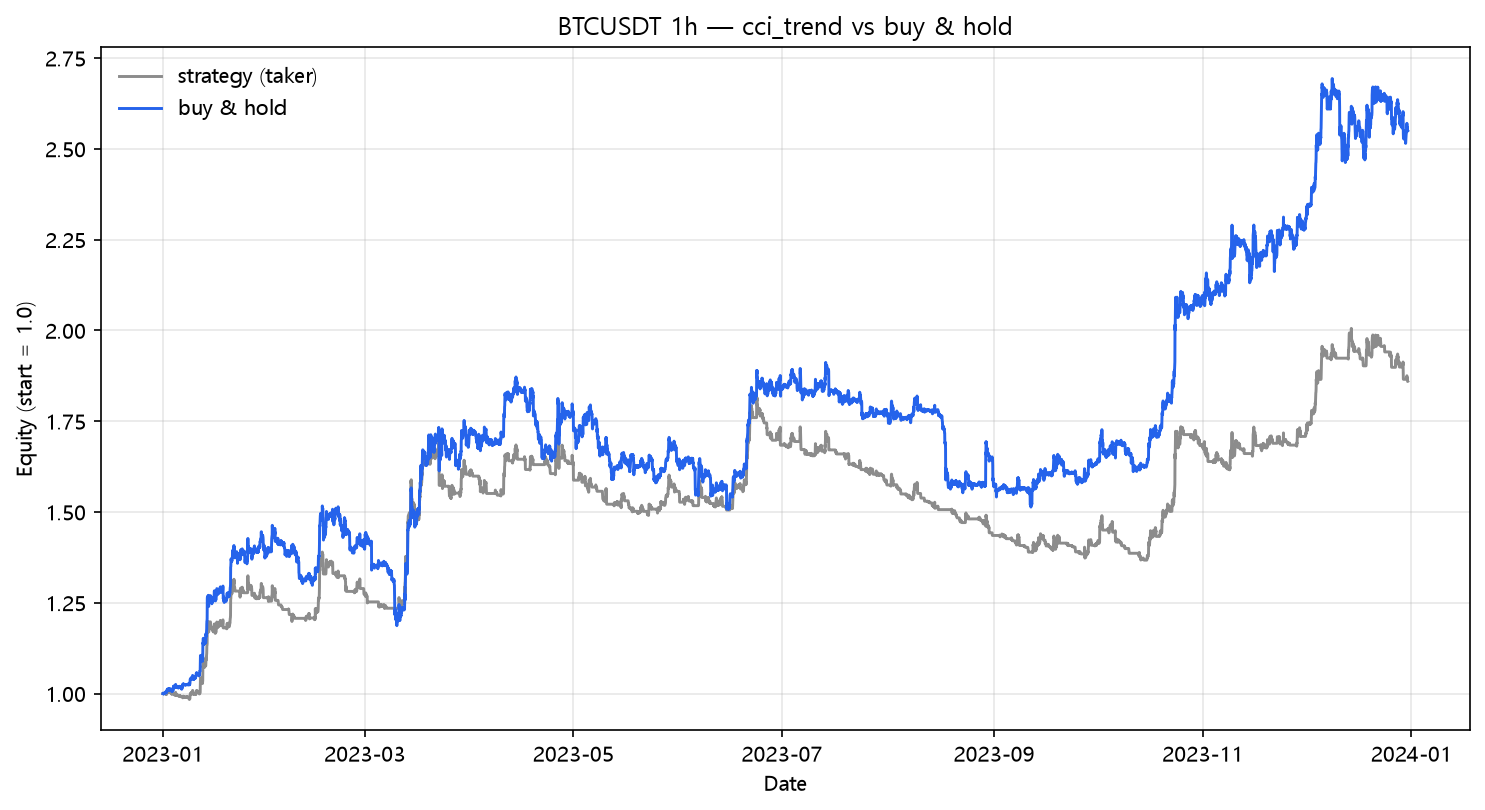
CCI(20) trend following (above +100, exit below -100) on real hourly BTC/USDT 2023: +134.75% naive, +85.98% after fees and funding, 178 trades. Post 26's CCI mean-reversion made +20.00% — orientation alone is worth 66 points.
CCI Trend Backtest on BTC/USDT (2023, hourly, real fees)
Post 26 tested CCI the "normal" way: buy when it dips below -100, sell when it recovers. That reversion made +20.00% net. This post does the opposite thing with the identical oscillator: treat a move above +100 as a trend signal and ride it until CCI falls below -100. The trend-flavored CCI made +85.98% net — 66 points more than the reversion flavor of the same formula, on the same data. Strategy Lab #62.
The setup
CCI(20) above +100 → long; CCI(20) below -100 → exit. Same engine, same costs.
Results
| Strategy | Category | Total return | CAGR | MaxDD | Sharpe | Trades |
|---|---|---|---|---|---|---|
| cci_trend | momentum | +85.98% | +86.31% | -24.64% | 2.05 | 178 |
The fee bill
| Scenario | Cost/leg | Total return | MaxDD | Sharpe | Trades | |---|---:|---:|---:|---:|---:|---:| | naive (zero cost) | 0.00% | +134.75% | -18.86% | 2.75 | 178 | | taker fee 0.05%/leg | 0.05% | +96.56% | -23.48% | 2.21 | 178 | | + funding 0.01%/8h | 0.05% | +85.98% | -24.64% | 2.05 | 178 | | + slippage 10bp/leg | 0.15% | +30.36% | -35.29% | 0.97 | 178 | | + slippage 25bp/leg | 0.30% | -23.56% | -53.63% | -0.64 | 178 |
The trend CCI is one of the best risk-adjusted strategies in the lab: net Sharpe 2.05, gross 2.75, and it stays positive through 10bp of slippage. It also briefly catches up to buy-and-hold gross (+134.75% vs +154.94%) while drawing down -18.9% to hold's -21.7%. The ±100 band acts as a confirmation filter: +100 is far enough out that the oscillator only enters in real extended moves.
The orientation experiment — same formula, opposite rule
| Orientation | Post | Trades | Naive | Fees+funding | |---|---:|---:|---:|---:|---:| | Trend: > +100 long | (this) | 178 | +134.75% | +85.98% | | Reversion: < -100 buy | 26 | 117 | +41.15% | +20.00% |
Same CCI(20), same +100/-100 thresholds, same data. The only difference is the arrow: ride the extension vs fade the extension. The trend version won by 66 net points, and its gross Sharpe of 2.75 beats every mean-reversion rule in the lab. 2023 BTC spent most of the year in trending regimes, so the regime rewarded trend orientation — the exact mirror of the reversion-flavored RSI(2)/Stochastic posts that thrived in the flat spring. The signal formula is secondary to which side of the market it takes. CCI is now one of the few families in the lab where both flavors work; it is just that one works four times better.
What this does NOT prove
- The ±100 thresholds are Donald Lambert's original defaults; tightening them (e.g. ±200) trades less and follows the lab's frequency pattern, but that is untested.
- This is a 2023 result. CCI trend following is a bet on persistence; a range-bound year would flip the ranking, as the 2023 spring did for the reversion rules.
- One pair, one year, one regime.
Code
from backtest_base import fetch, backtest_signal, metrics
from strategy import sig_cci_trend

df = fetch("BTCUSDT", "binance", "2023-01-01", "2023-12-31", "1h")
signal = sig_cci_trend(df, period=20)

res = backtest_signal(df, signal, cost_per_leg=0.0005, funding_per_bar=0.0000125)
print(metrics(res, 8760))
Reproduce it
cd blog-drafts/scripts
python gen_post_assets.py --ids 62
Data: Binance public API, hourly OHLCV, 8,735 bars. Tables above reproduce exactly from this command.
This is a backtest on historical data, not investment advice. Past performance does not predict future results.