Money Flow Index Backtest on BTC/USDT: Volume-Weighted RSI, Same Mean-Reversion Verdict
The Money Flow Index (MFI 20/80) on real hourly BTC/USDT 2023: +18.87% naive, +9.01% with fees/funding, -8.98% at 25bp across 36 trades. When adding volume to RSI changes the trades but not the story.
Money Flow Index Backtest on BTC/USDT (2023, hourly, real fees)
If RSI(14) is "RSI without volume," the Money Flow Index is the version with it: typical price × volume becomes money flow, up-moves and down-moves are separated by direction, and the 14-bar ratio is scaled to 0–100 exactly like RSI. The textbook reversion reads: buy under 20, sell above 80. The pitch is that volume confirms whether a move is real, so MFI's extremes are "more real" than RSI's. I tested that pitch on hourly BTC/USDT with the same engine as the RSI(14) post, and the volume filter changed the trades but not the verdict. Strategy Lab #29.
The checklist
- Rule — buy when MFI(14) < 20, exit when MFI(14) > 80.
- Data — Binance BTCUSDT 1h, 2023, 8,735 bars.
- Cost model — the five standard scenarios.
- Hypothesis — volume-weighted extremes are rarer and more reliable than RSI's.
- Question — does "more reliable" survive the cost model, or just trade less?
Results
| Strategy | Category | Total return | CAGR | MaxDD | Sharpe | Trades |
|---|---|---|---|---|---|---|
| mfi | meanrev | +9.01% | +9.03% | -26.50% | 0.46 | 36 |
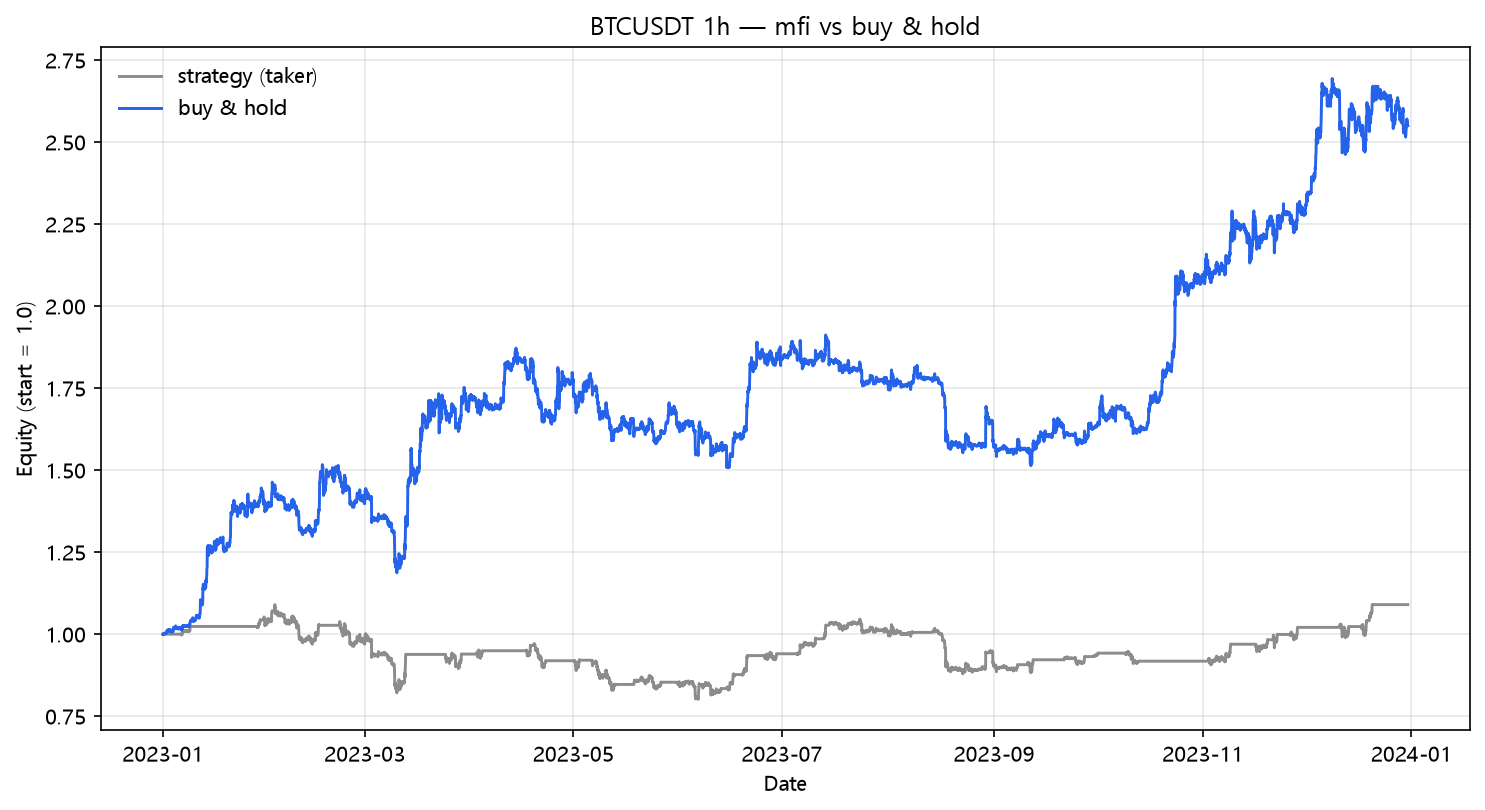
The hypothesis about trade count held: 36 trades, barely more than RSI(14)'s 33 — volume did filter out weak extremes. The reliability part is where it wobbles. Naive MFI made +18.87% (about the same as RSI(14)'s +17.71%), but its drawdown was worse (-24.36% vs -15.50%): the volume-weighted signals arrived at the same dips, just later and deeper, because high volume tends to coincide with the bottom of the hole. More confirmation, worse entry.
The fee bill
| Scenario | Cost/leg | Total return | MaxDD | Sharpe | Trades | |---|---:|---:|---:|---:|---:|---:| | naive (zero cost) | 0.00% | +18.87% | -24.36% | 0.79 | 36 | | taker fee 0.05%/leg | 0.05% | +14.66% | -25.04% | 0.65 | 36 | | + funding 0.01%/8h | 0.05% | +9.01% | -26.50% | 0.46 | 36 | | + slippage 10bp/leg | 0.15% | +1.43% | -27.81% | 0.19 | 36 | | + slippage 25bp/leg | 0.30% | -8.98% | -29.74% | -0.23 | 36 |
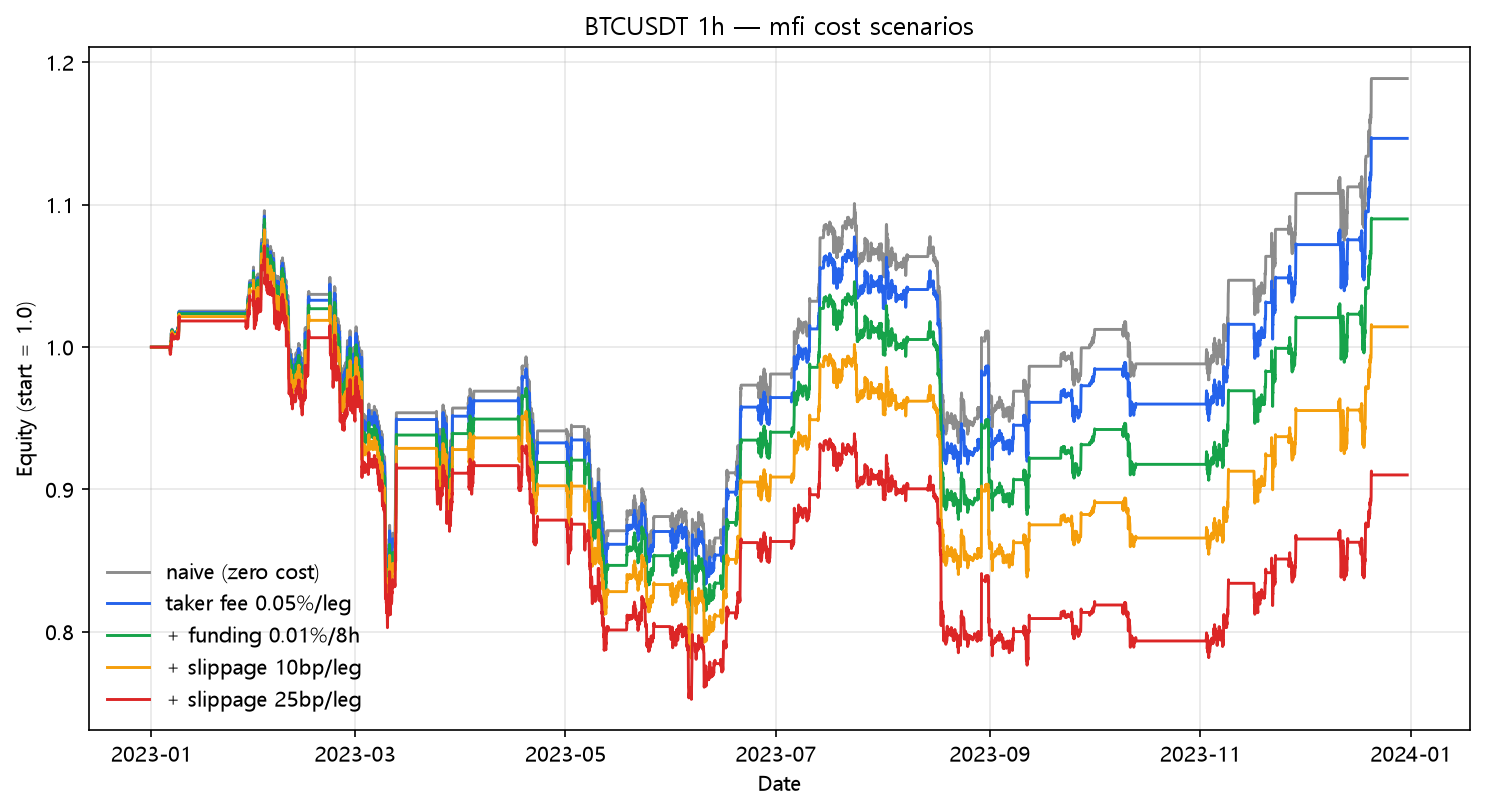
+18.87% → -8.98%. 72 legs means the annual fee bill is only ~4.5%, so the descent is gentle — the same stability pattern RSI(14) showed. Win rate was 72.2% (26/36), the highest in the reversion group, and it still loses at 25bp. The recurring lab theme again: high win rate + reversion = small edges, and small edges are the first thing costs take. Volume didn't rescue it; it just made the failure slower.
What this does NOT prove
- MFI 20/80 is the standard pair; a wider gap (10/90) trades even less and, judging by RSI(14), stays stable but still doesn't beat holding.
- 36 trades is a whisper of a sample. Don't quote the +9.01% as anything except "positive this year."
- "Volume confirms extremes" may hold better on stocks (where volume is cleaner than crypto exchange volume). The AAPL 1d reversion (post 11) is the place to look for that.
Code
from backtest_base import fetch, backtest_signal, metrics

df = fetch("BTCUSDT", "binance", "2023-01-01", "2023-12-31", "1h")
tp = (df["high"] + df["low"] + df["close"]) / 3.0
mf = tp * df["volume"]
pos = mf.where(tp > tp.shift(1), 0.0)
neg = mf.where(tp < tp.shift(1), 0.0)
ratio = pos.rolling(14).sum() / neg.rolling(14).sum().replace(0.0, np.nan)
mfi = 100.0 - 100.0 / (1.0 + ratio)

enter = (mfi < 20.0).to_numpy()
exit_ = (mfi > 80.0).to_numpy()
position = np.zeros(len(df), dtype=bool)
held = False
for i in range(len(df)):
    if not held and enter[i]:
        held = True
    elif held and exit_[i]:
        held = False
    position[i] = held

signal = pd.Series(position, index=df.index)
res = backtest_signal(df, signal, cost_per_leg=0.0005,
                      funding_per_bar=0.0001 / 8.0)
print(metrics(res, 8760))
Reproduce it
cd blog-drafts/scripts
python backtest_base.py --strategy mfi --symbol BTCUSDT --interval 1h \
    --start 2023-01-01 --end 2023-12-31 --fee 0.0005 --funding 0.0000125
Data: Binance public API, hourly OHLCV, 8,735 bars. The tables above reproduce exactly from this command.
This is a backtest on historical data, not investment advice. Past performance does not predict future results.