The Mean Reversion Bench: RSI, Stochastic, Williams, CCI, MFI, %B — the Uncomfortable Table
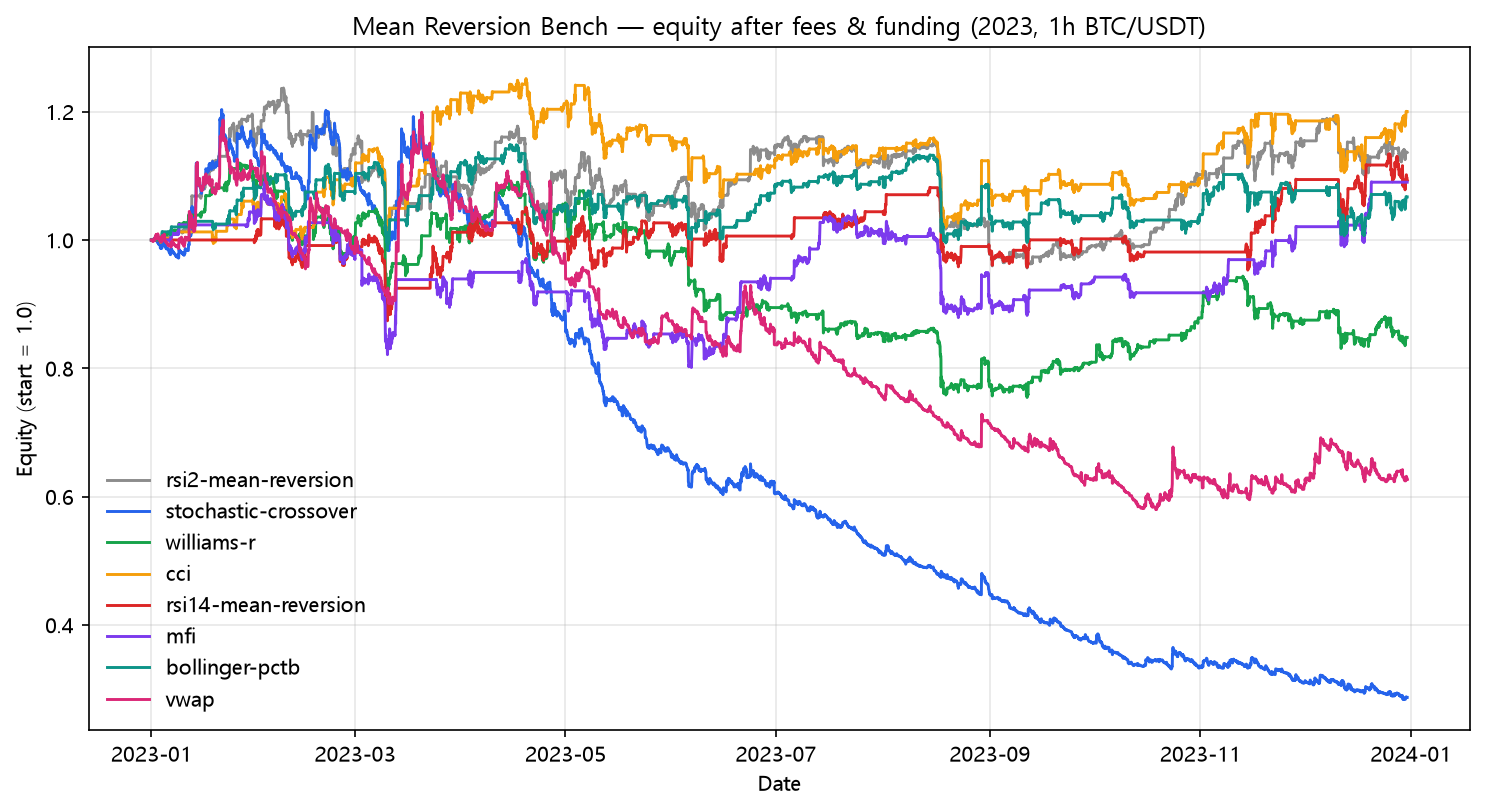
Eight mean reversion strategies on the same hourly BTC/USDT 2023: only the slow ones survive fees. RSI(14) +9.26%, MFI +9.01%, CCI +20.00% — the fast ones (Stochastic -71.31%, VWAP -37.36%, Williams -15.19%) are a fee machine. Full bench table.
The Mean Reversion Bench: RSI, Stochastic, Williams, CCI, MFI, %B
The reversion family is the emotional opposite of the trend family, so it gets its own bench. Eight strategies that all bet "this has moved too far, it will snap back," all run on the same hourly BTC/USDT 2023, all through the same engine. The result is the least comfortable table in the lab. Strategy Lab #38.
The contestants
- RSI(2) (post 08): buy below 10, sell above 90 — 269 trades.
- RSI(14) (post 28): buy below 30, sell above 70 — 33 trades.
- Stochastic (post 10): %K/%D crossover — 1,798 trades.
- Williams %R (post 27): below -80 / above -20 — 187 trades.
- CCI (post 26): below -100 / above +100 — 117 trades.
- MFI (post 29): volume-weighted RSI — 36 trades.
- Bollinger %B (post 30): lower-band touch / mid touch — 112 trades.
- VWAP (post 12): hourly session reversion — 975 trades.
The bench
| # | Strategy | Post | Naive | Fees+funding | 25bp | Trades |
|---|---|---|---|---|---|---|
| 08 | RSI(2) mean reversion | [rsi2-mean-reversion](/blog/rsi2-mean-reversion) | +56.32% | +13.64% | -70.39% | 269 |
| 10 | Stochastic %K/%D crossover | [stochastic-crossover](/blog/stochastic-crossover) | +79.05% | -71.31% | -100.00% | 1798 |
| 27 | Williams %R mean reversion | [williams-r](/blog/williams-r) | +7.40% | -15.19% | -66.76% | 187 |
| 26 | CCI mean reversion (below -100) | [cci](/blog/cci) | +41.15% | +20.00% | -33.22% | 117 |
| 28 | RSI(14) mean reversion (30/70) | [rsi14-mean-reversion](/blog/rsi14-mean-reversion) | +17.71% | +9.26% | -7.16% | 33 |
| 29 | Money Flow Index mean reversion | [mfi](/blog/mfi) | +18.87% | +9.01% | -8.98% | 36 |
| 30 | Bollinger %B mean reversion | [bollinger-pctb](/blog/bollinger-pctb) | +24.93% | +6.71% | -39.11% | 112 |
| 12 | Session VWAP mean reversion (hourly) | [vwap](/blog/vwap) | +73.20% | -37.36% | -99.52% | 975 |
The split is one variable: speed
The bench sorts itself by trade count, not by indicator. Every strategy trading under 120 times was net positive after fees and funding (CCI +20.00%, RSI14 +9.26%, MFI +9.01%, %B +6.71%). Every strategy trading over 150 times was net negative (Stochastic -71.31%, VWAP -37.36%, Williams -15.19%). RSI(2)'s 269 trades put it exactly on the boundary (+13.64%).
The reversion edge decays in hours. These strategies re-enter constantly because the oscillator keeps touching its band. Each touch is a bet that has to pay for a round trip (fees, funding, and whatever slippage you can't see), and the edge just doesn't recur often enough to pay for the activity. Stochastic touched 1,798 times and turned a +79.05% gross year into a -71.31% net one.
Two strategies are real, and both are slow
- CCI (post 26): +41.15% naive → +20.00% net, 117 trades. The best reversion in the lab, and even it gives back half its gross edge to costs and still lands positive. At 25bp it is -33.22%.
- RSI(14) (post 28): +17.71% → +9.26% net, 33 trades, and only -7.16% even at 25bp. It's the most cost-resilient reversion rule, because it almost never trades.
Compare that with the two slow trend rules from post 37: EMA crossover was +89.38% net and +51.17% at 25bp. On 2023 BTC, mean reversion's ceiling was CCI's +20%; the trend family's floor was higher than the reversion family's ceiling. That is the one-line summary of this lab's year.
What this does NOT prove
- A mean reversion strategy wants a range year. 2023 was a +155% trend year. On 2018's bear or 2024's chop the ranking would not be the same — the frequency lesson (slow beats fast) almost certainly would be.
- These are single-parameter defaults (RSI 30/70, CCI ±100, Stoch 14/3). Grids exist that trade less; post 26's deeper thresholds are the direction this family would improve.
Code
import pandas as pd
from backtest_base import backtest_signal, metrics
from strategy import STRATEGIES

df = pd.read_pickle("assets/data/binance_BTCUSDT_1h_2023-01-01_2023-12-31.pkl")
rev = ["rsi_meanrev", "stoch", "williams_r", "cci",
       "rsi14_meanrev", "mfi", "bollinger_pctb", "vwap"]

for name in rev:
    spec = STRATEGIES[name]
    signal = spec["func"](df, **spec["params"])
    res = backtest_signal(df, signal, cost_per_leg=0.0005, funding_per_bar=0.0000125)
    m = metrics(res, 8760)
    print(f"{name:<16} {m['total_return']:+9.2%}  trades {m['trades']}")
Reproduce it
cd blog-drafts/scripts
python gen_special_assets.py   # regenerates this chart + all group tables
Data: Binance public API, hourly OHLCV, 8,735 bars. Every number above reproduces from the manifest + post.json of posts 08, 10, 27, 26, 28, 29, 30, 12.
This is a backtest on historical data, not investment advice. Past performance does not predict future results.