MACD Crossover Backtest on BTC/USDT: The Default Indicator's Real Price
MACD is on every chart by default — the Times New Roman of trading. Its crossover backtests +79.08% on real hourly BTC/USDT and -76.89% with realistic costs across 333 trades. Pandas implementation, charts, and why the default isn't free.
MACD Crossover Backtest on BTC/USDT (2023, hourly, real fees)
MACD is the Times New Roman of trading indicators. It's the default on every charting platform, the first thing beginners see, and so familiar that nobody questions it. Times New Roman isn't a bad font — it's just not a personality. MACD, I'm about to show you, isn't a bad indicator either. But trading it as-is on hourly crypto costs more than it earns. Strategy Lab #15.
What MACD is
MACD is momentum measured as a gap between two EMAs, then smoothed again:
MACD line = EMA(12) − EMA(26)— how fast price is moving relative to its recent average.signal line = EMA(9) of the MACD line.- Rule: long while the MACD line is above its signal line.
Every platform ships these numbers. There is nothing secret about them, which is the whole point of testing them: this is the most popular oscillator settings on earth, running on the most traded crypto pair, on the timeframe that has become crypto's default. 333 trades in 2023.
Results
| Strategy | Category | Total return | CAGR | MaxDD | Sharpe | Trades |
|---|---|---|---|---|---|---|
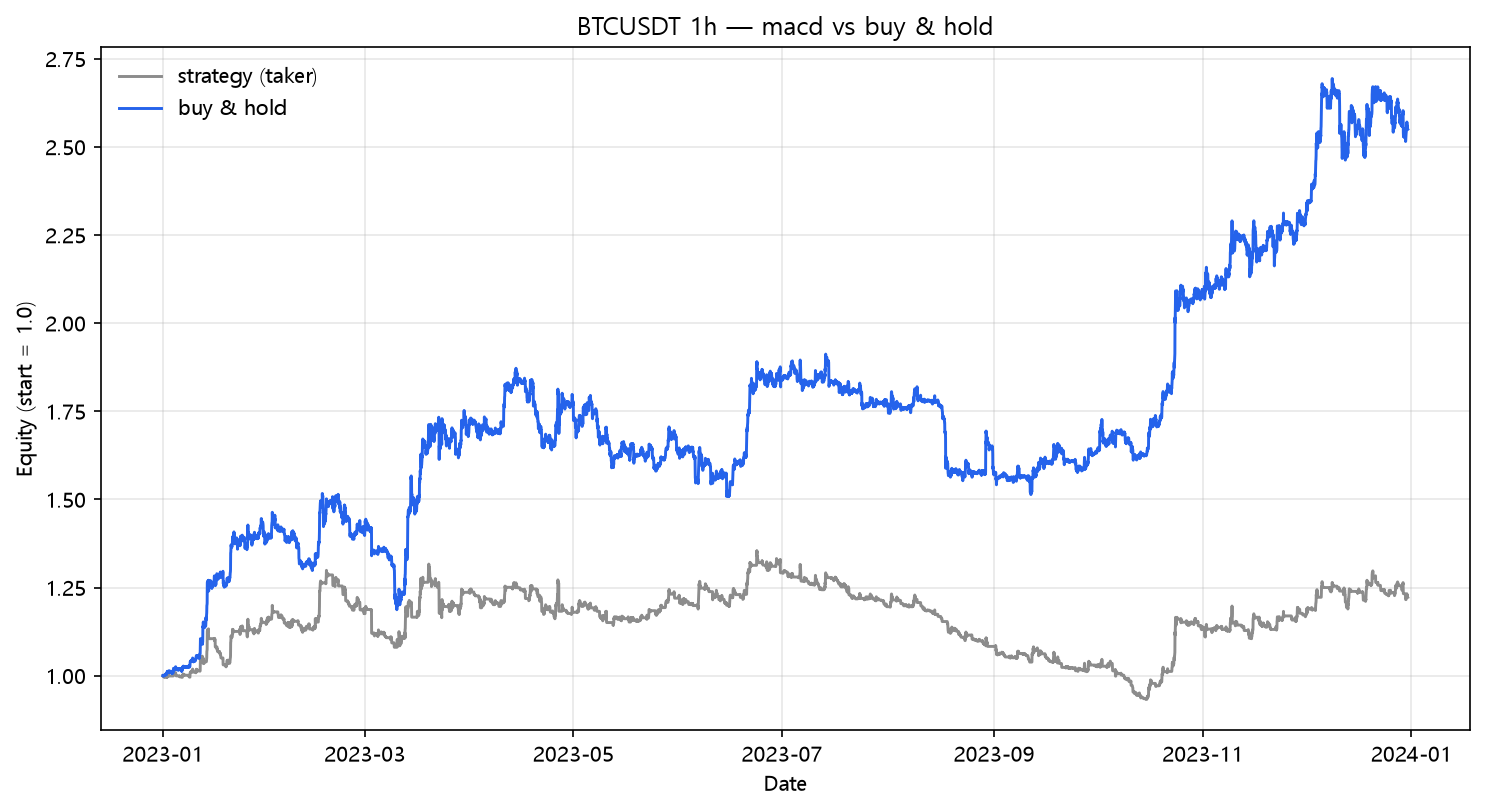
| macd | momentum | +22.21% | +22.28% | -31.11% | 0.80 | 333 |
The zero-cost version flatters you
| Scenario | Cost/leg | Total return | MaxDD | Sharpe | Trades |
|---|---|---|---|---|---|
| naive (zero cost) | 0.00% | +79.08% | -21.18% | 2.04 | 333 |
| taker fee 0.05%/leg | 0.05% | +28.41% | -29.99% | 0.96 | 333 |
| + funding 0.01%/8h | 0.05% | +22.21% | -31.11% | 0.80 | 333 |
| + slippage 10bp/leg | 0.15% | -37.19% | -54.27% | -1.34 | 333 |
| + slippage 25bp/leg | 0.30% | -76.89% | -78.28% | -4.45 | 333 |
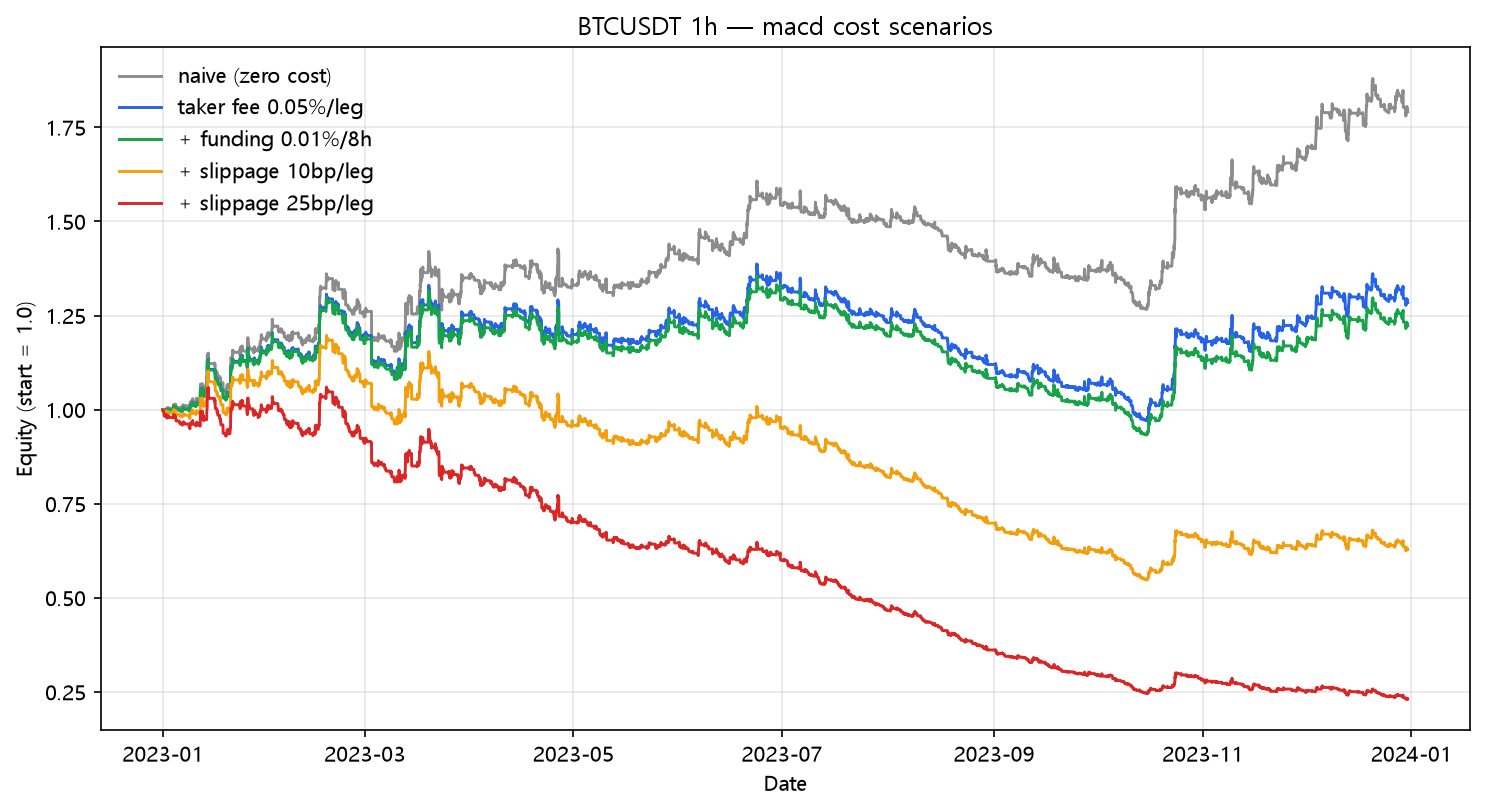
+79.08% → -76.89%. The naive MACD has a Sharpe of 2.04 — genuinely good-looking. Then the fee model shows up and it's a 45-point drop to the taker row, then another 99 points of slippage. The reason is the same as every churn post in this series: 333 signals means 665 fee-paying legs. The MACD line crosses its signal line constantly on hourly candles because both are lagged — you're getting confirmed twice after the move, then paying for the confirmation.
Buy and hold comparison
| Strategy | Total return | CAGR | MaxDD | Sharpe |
|---|---|---|---|---|
| macd | +22.21% | +22.28% | -31.11% | 0.80 |
| buy & hold | +154.94% | +155.62% | -21.74% | 2.42 |
What this does NOT prove
- This is the raw crossover — the 12/26/9 defaults. Real MACD users wait for histogram turns near zero or add divergence, which cuts trade count sharply. The default is what most people actually trade, so it's what I tested.
- One symbol, one year. MACD's lag hurts most in choppy regimes; the finding that matters is structural: a momentum indicator that re-confirms every trend change will trade more often than a trend indicator, and it must be priced accordingly.
- The naive Sharpe of 2.04 is the warning sign to remember: when a backtest looks this good with the most popular settings, check the trade count before you check the return.
Code
from backtest_base import fetch, backtest_signal, metrics

df = fetch("BTCUSDT", "binance", "2023-01-01", "2023-12-31", "1h")
close = df["close"]
macd = close.ewm(span=12, adjust=False).mean() - close.ewm(span=26, adjust=False).mean()
signal_line = macd.ewm(span=9, adjust=False).mean()

signal = (macd > signal_line).fillna(False)
res = backtest_signal(df, signal, cost_per_leg=0.0005,
                      funding_per_bar=0.0001 / 8.0)
print(metrics(res, 8760))
Reproduce it
cd blog-drafts/scripts
python backtest_base.py --strategy macd --symbol BTCUSDT --interval 1h \
    --start 2023-01-01 --end 2023-12-31 --fee 0.0005 --funding 0.0000125
Data: Binance public API, hourly OHLCV, 8,735 bars. The tables above reproduce exactly from this command.
This is a backtest on historical data, not investment advice. Past performance does not predict future results.