Force Index Backtest on BTC/USDT: The Volume x Price Rule That Spent a Bull Year in the Red
The Force Index (price change x volume, EMA 13) on real hourly BTC/USDT 2023: +43.34% naive, -17.50% with fees and funding, -93.47% at 25bp across 507 trades. Why volume-weighted momentum doubles down on choppy signals.
Force Index Backtest on BTC/USDT (2023, hourly, real fees)
The Force Index is Alexander Elder's attempt to make momentum honest: multiply each bar's price change by its volume, smooth it with an EMA, and the sign of the smoothed line is supposed to tell you who's really in control — big moves on big volume count more than big moves on empty tape. Long when the EMA(13) of (Δclose × volume) is positive. It's a reasonable idea that I have used for years as a diagnostic in my notes. Then I wired it as a standalone switch, and in a year when BTC nearly doubled, this momentum diagnostic produced -17.50% after costs. I spent an evening being annoyed at the number before realizing the number was the point. Strategy Lab #33.
Results
| Strategy | Category | Total return | CAGR | MaxDD | Sharpe | Trades |
|---|---|---|---|---|---|---|
| force_index | momentum | -17.50% | -17.55% | -47.56% | -0.44 | 507 |
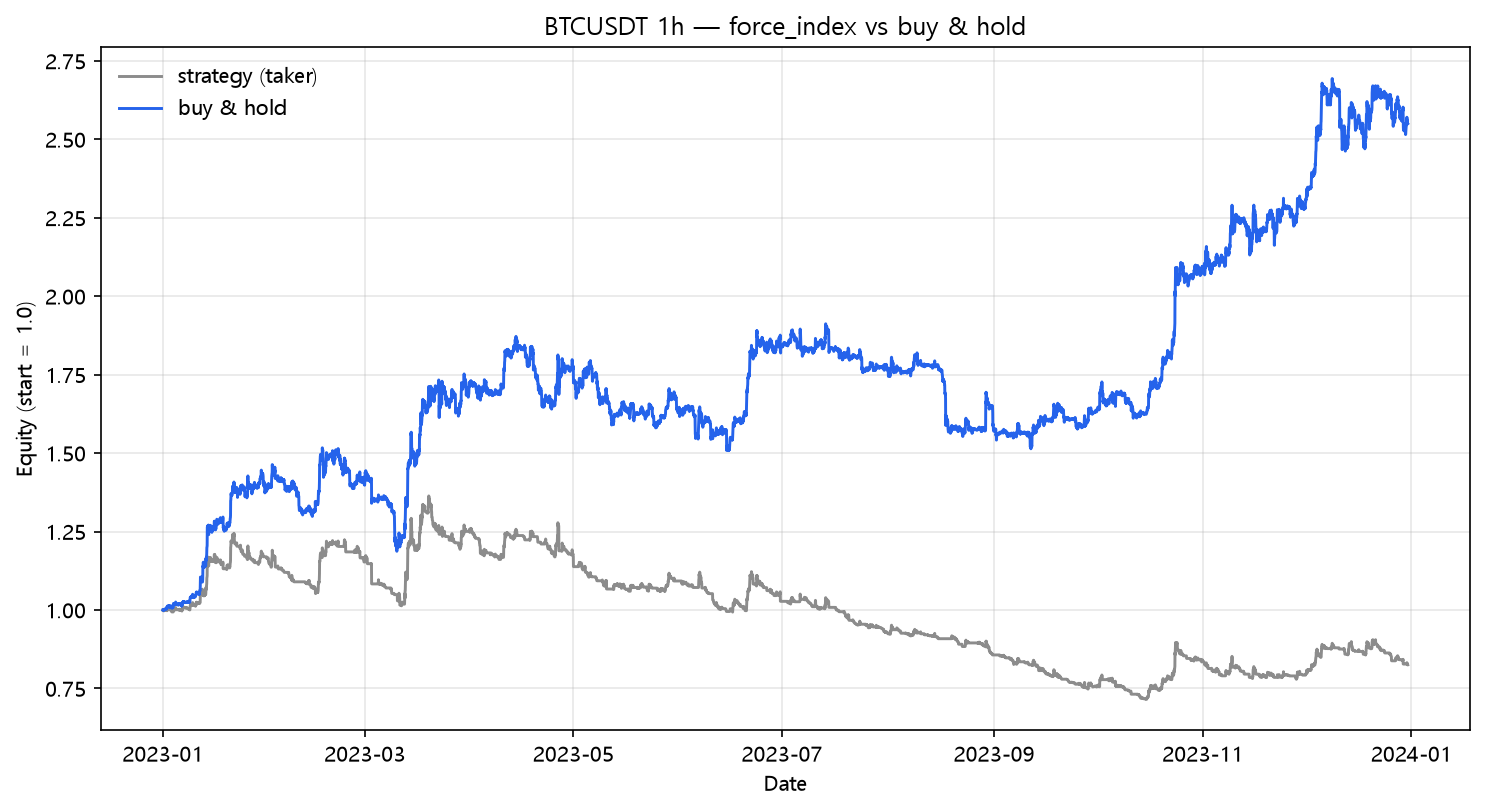
Naive Force Index made +43.34% — and 507 round trips. Volume-weighting didn't reduce churn, it increased it: every spike in volume, even inside a flat stretch, flips the smoothed sign and generates a trade. A diagnostic that's great at telling you "who's in control right now" is, by construction, bad at deciding "stay invested through next Tuesday" — it changes its mind every time volume hiccups.
The fee bill
| Scenario | Cost/leg | Total return | MaxDD | Sharpe | Trades | |---|---:|---:|---:|---:|---:|---:| | naive (zero cost) | 0.00% | +43.34% | -26.74% | 1.29 | 507 | | taker fee 0.05%/leg | 0.05% | -13.63% | -46.27% | -0.30 | 507 | | + funding 0.01%/8h | 0.05% | -17.50% | -47.56% | -0.44 | 507 | | + slippage 10bp/leg | 0.15% | -70.07% | -74.75% | -3.59 | 507 | | + slippage 25bp/leg | 0.30% | -93.47% | -94.08% | -8.08 | 507 |
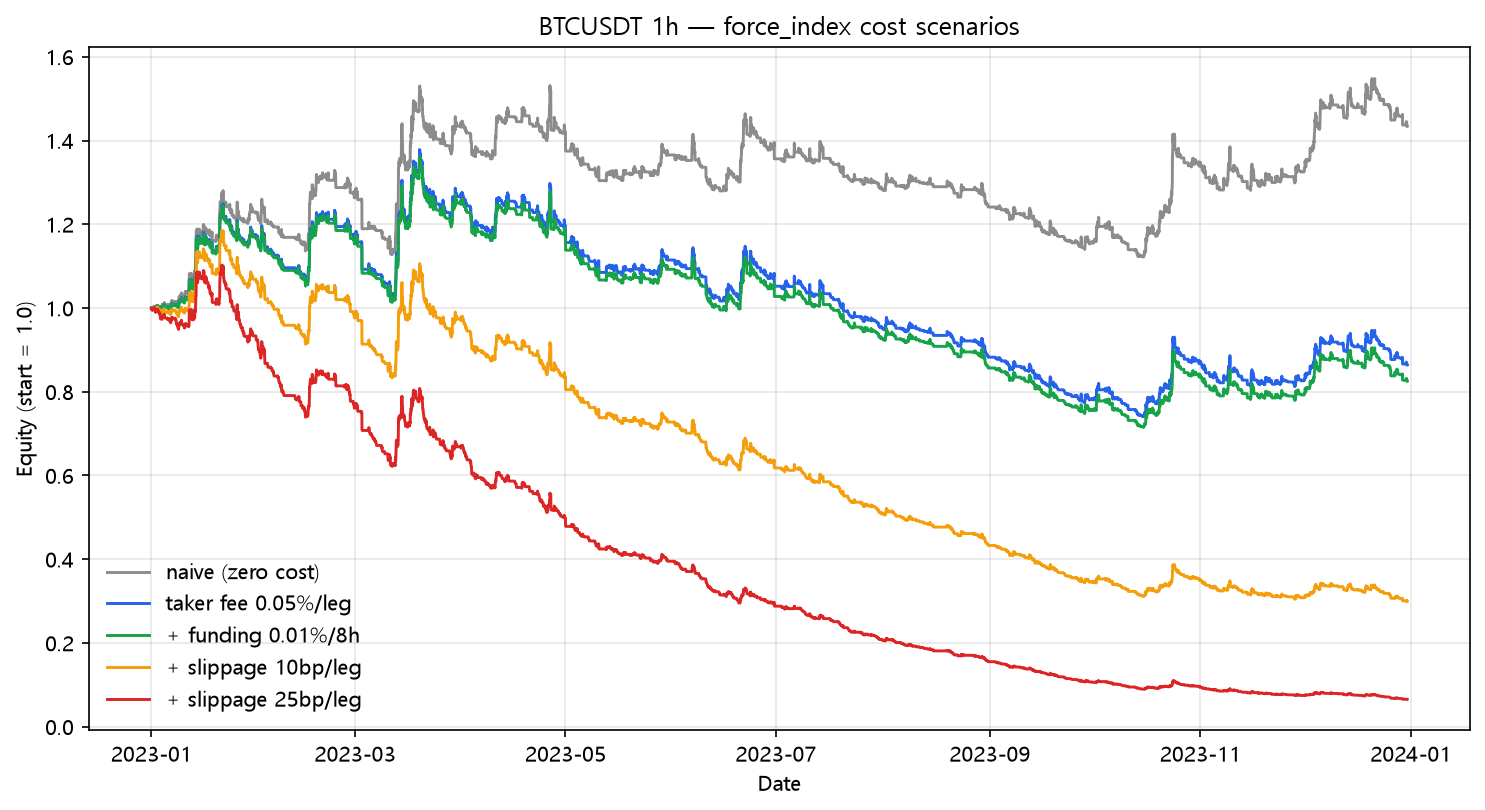
+43.34% → -93.47%. 1,013 legs at 25bp is 63.31% of the account per year. Win rate was 38.3% (194/507) — low-hit, high-churn, the exact profile that converts a diagnostic into a subscription to the exchange. The -47.56% funded drawdown is the deepest in the momentum family, worse than the underlying's own -21.74% hole.
What this does NOT prove
- The Force Index as a confirmation filter (don't short when it's rising) is where it earns its keep — standalone-switch was the harshest test I could run, and it failed it.
- EMA(13) is Elder's default; a much slower smooth (say 50) would flip far less often. Volume spikiness is the real enemy, and no EMA length fully fixes it on hourly crypto.
- 2023's directionality again punished a momentum line that keeps resetting to neutral. A trend filter on top is the obvious repair.
Code
from backtest_base import fetch, backtest_signal, metrics

df = fetch("BTCUSDT", "binance", "2023-01-01", "2023-12-31", "1h")
force = df["close"].diff() * df["volume"]
fi = force.ewm(span=13, adjust=False).mean()

signal = (fi > 0.0).fillna(False)
res = backtest_signal(df, signal, cost_per_leg=0.0005,
                      funding_per_bar=0.0001 / 8.0)
print(metrics(res, 8760))
Reproduce it
cd blog-drafts/scripts
python backtest_base.py --strategy force_index --symbol BTCUSDT --interval 1h \
    --start 2023-01-01 --end 2023-12-31 --fee 0.0005 --funding 0.0000125
Data: Binance public API, hourly OHLCV, 8,735 bars. The tables above reproduce exactly from this command.
This is a backtest on historical data, not investment advice. Past performance does not predict future results.