Fisher Transform Backtest on BTC/USDT: the First Strategy That Lost Before Fees
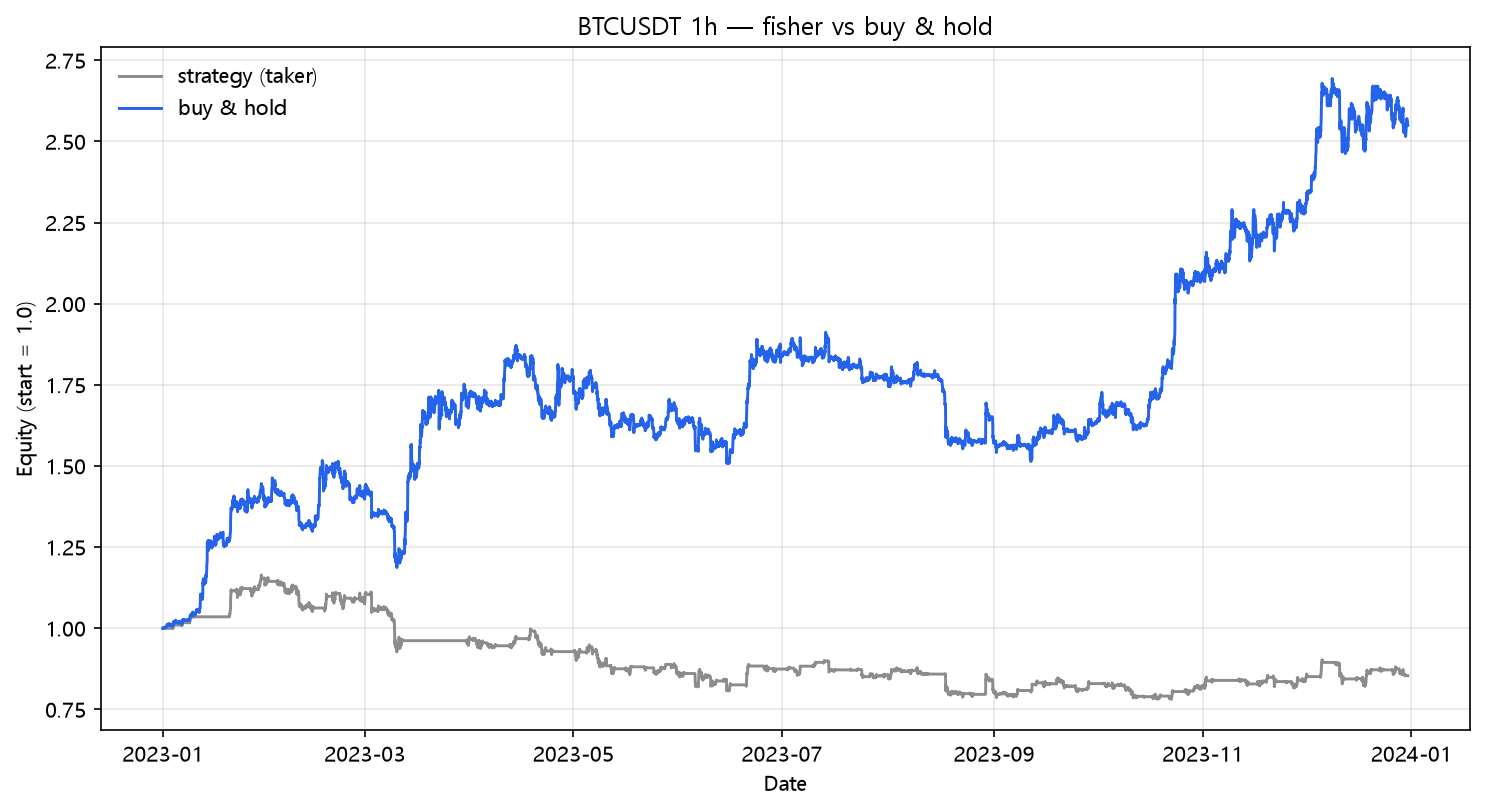
The Fisher Transform on real hourly BTC/USDT 2023: -1.41% even with zero costs, -14.63% net, -46.95% at 25bp across 95 trades. The only strategy in 53 posts whose gross edge was already negative.
Fisher Transform Backtest on BTC/USDT (2023, hourly, real fees)
Most failures in this lab have a hero's arc: a beautiful gross number, then the cost model does the damage. The Fisher Transform is different — it's the first strategy in 53 posts whose gross return was negative. John Ehlers' idea is elegant: price isn't normal, so transform it into something that is, then trade the extremes of the distribution. On 2023 BTC, the extremes didn't cooperate. Strategy Lab #54.
The setup
Fisher Transform maps the 9-bar price range into a normalized score roughly bounded by ±2. The reversion rule: buy when the Fisher value crosses up through −2.0 (deep oversold), sell when it crosses down through +2.0 (deep overbought). Same engine, same costs.
Results
| Strategy | Category | Total return | CAGR | MaxDD | Sharpe | Trades |
|---|---|---|---|---|---|---|
| fisher | meanrev | -14.63% | -14.63% | -32.94% | -0.47 | 95 |
The fee bill (with a strange first row)
| Scenario | Cost/leg | Total return | MaxDD | Sharpe | Trades | |---|---:|---:|---:|---:|---:|---:| | naive (zero cost) | 0.00% | -1.41% | -27.30% | 0.08 | 95 | | taker fee 0.05%/leg | 0.05% | -10.35% | -30.42% | -0.28 | 95 | | + funding 0.01%/8h | 0.05% | -14.63% | -32.94% | -0.47 | 95 | | + slippage 10bp/leg | 0.15% | -29.41% | -41.12% | -1.19 | 95 | | + slippage 25bp/leg | 0.30% | -46.95% | -53.23% | -2.25 | 95 |
Read the first row: -1.41% with zero costs. Every other reversion strategy in this lab — even the ones that died later — had a positive gross edge. Fisher did not. The +2/−2 thresholds are so deep that on a strong uptrend the strategy is almost never in the market (95 trades, but short holds at the few real dips), and those dips kept falling through the -2 line without snapping back the way a range market would. The transform found "statistical extremes" that the +155% trend simply flattened.
The reversion family keeps splitting
The lab's mean-reversion verdict now has a clean two-way split on 2023 BTC: the slow threshold rules that waited for real dislocations (Ultimate +24.51%, Z-Score +20.25%, CCI +20.00%) made money; the ones tuned to normal distributions with tighter or deeper gates (Fisher -14.63%, Williams -15.19%, StochRSI -6.61%) did not. Fisher is the most statistically sophisticated loser — and its -1.41% gross number is the honest measurement that "sophisticated" doesn't mean "profitable."
What this does NOT prove
- Fisher is often paired with a 0.5× or 0.25× scale on the entry (e.g., cross of -1.0) to catch earlier turns. Those variants trade more often and are untested here.
- The transform's real reputation is for turning-point timing on a discretionary chart, not for an automated threshold rule.
- One pair, one year, one regime. A genuinely mean-reverting 2024 would be Fisher's natural habitat — the -1.41% gross says it would still be a coin flip there.
Code
from backtest_base import fetch, backtest_signal, metrics
from strategy import sig_fisher

df = fetch("BTCUSDT", "binance", "2023-01-01", "2023-12-31", "1h")
signal = sig_fisher(df, period=9)

res = backtest_signal(df, signal, cost_per_leg=0.0005, funding_per_bar=0.0000125)
print(metrics(res, 8760))
Reproduce it
cd blog-drafts/scripts
python gen_post_assets.py --ids 54
Data: Binance public API, hourly OHLCV, 8,735 bars. Tables above reproduce exactly from this command.
This is a backtest on historical data, not investment advice. Past performance does not predict future results.