Momentum Backtest on BTC/USDT: The 785-Trade Rule and the Slowest Death in the Lab
The classic Momentum rule (close > close N bars ago) on real hourly BTC/USDT 2023: +74.31% naive, -24.00% with fees/funding, -98.51% at 25bp across 785 trades. The highest churn of the entire series and what it says about 'buy strength.'
Momentum Backtest on BTC/USDT (2023, hourly, real fees)
Momentum, in its purest quantitative form, is one line: buy when the close is above the close from N bars ago. It's the most studied effect in academic finance — past returns predict future returns over months. My version uses N=10 on hourly bars, because that's the honest test of whether the concept itself transfers to crypto trading, and the answer is a loud no at this frequency. 785 trades in one year — the most in the entire Strategy Lab — turned +74.31% of zero-cost fantasy into -24.00% of funded reality, and then into -98.51% at 25bp. The effect is real. The translation is not. Strategy Lab #35.
Results
| Strategy | Category | Total return | CAGR | MaxDD | Sharpe | Trades |
|---|---|---|---|---|---|---|
| momentum | momentum | -24.00% | -24.06% | -40.34% | -0.69 | 785 |
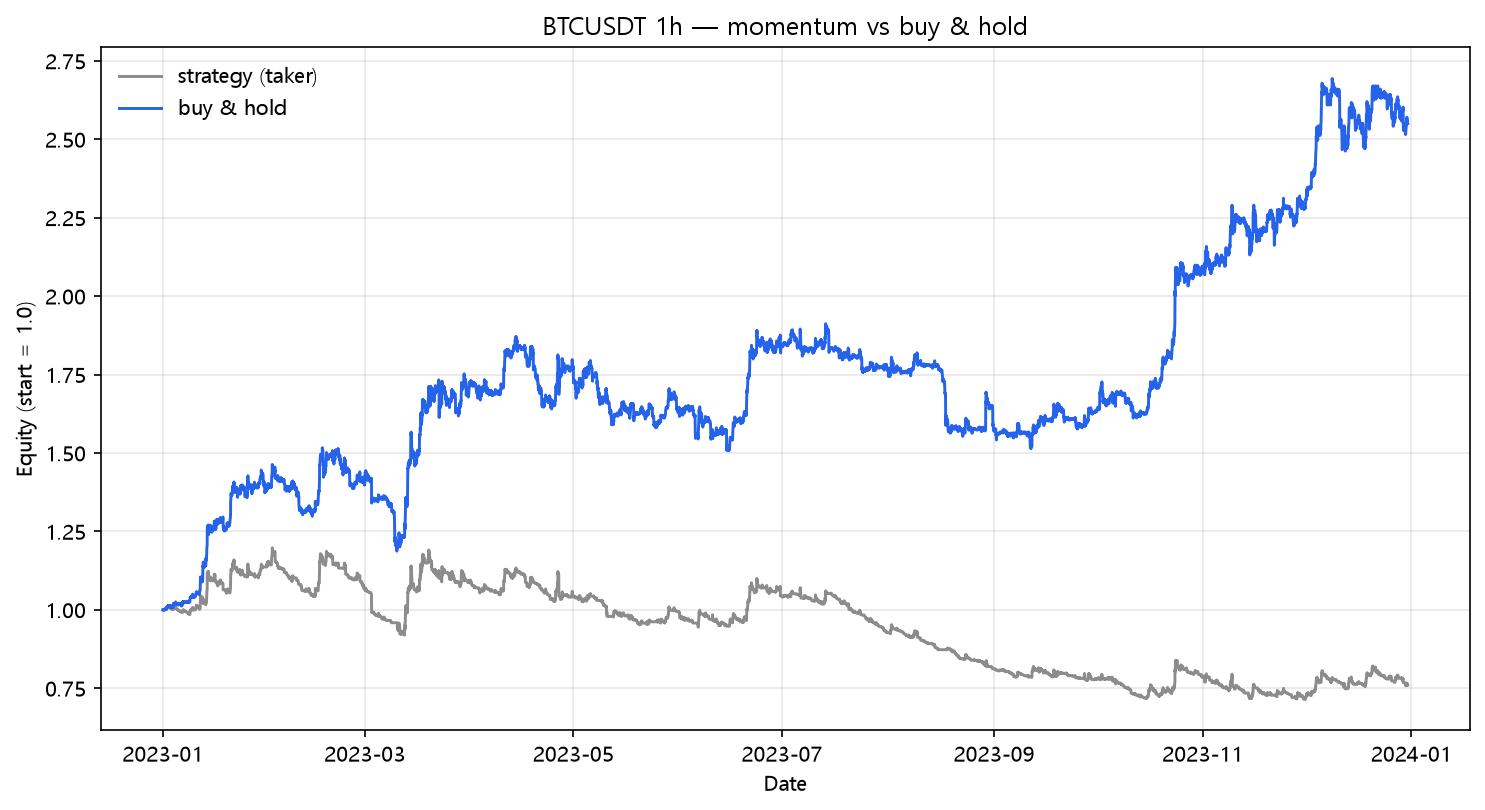
The naive run made +74.31% — which is the momentum effect doing its thing. Then the cost model starts: at taker fees the strategy is already at -20.47%. The rule "buy strength" is only wrong in a subtle way: on an hourly tape, "strength over the last 10 hours" is re-established constantly, so the strategy is in the market nearly all year and trades 785 times to stay there. It ends up worse than holding a coin that doubled, because the effect is tiny at 10 hours and the churn is enormous.
The fee bill
| Scenario | Cost/leg | Total return | MaxDD | Sharpe | Trades | |---|---:|---:|---:|---:|---:|---:| | naive (zero cost) | 0.00% | +74.31% | -18.45% | 1.89 | 785 | | taker fee 0.05%/leg | 0.05% | -20.47% | -38.26% | -0.55 | 785 | | + funding 0.01%/8h | 0.05% | -24.00% | -40.34% | -0.69 | 785 | | + slippage 10bp/leg | 0.15% | -84.20% | -85.14% | -5.51 | 785 | | + slippage 25bp/leg | 0.30% | -98.51% | -98.52% | -12.26 | 785 |
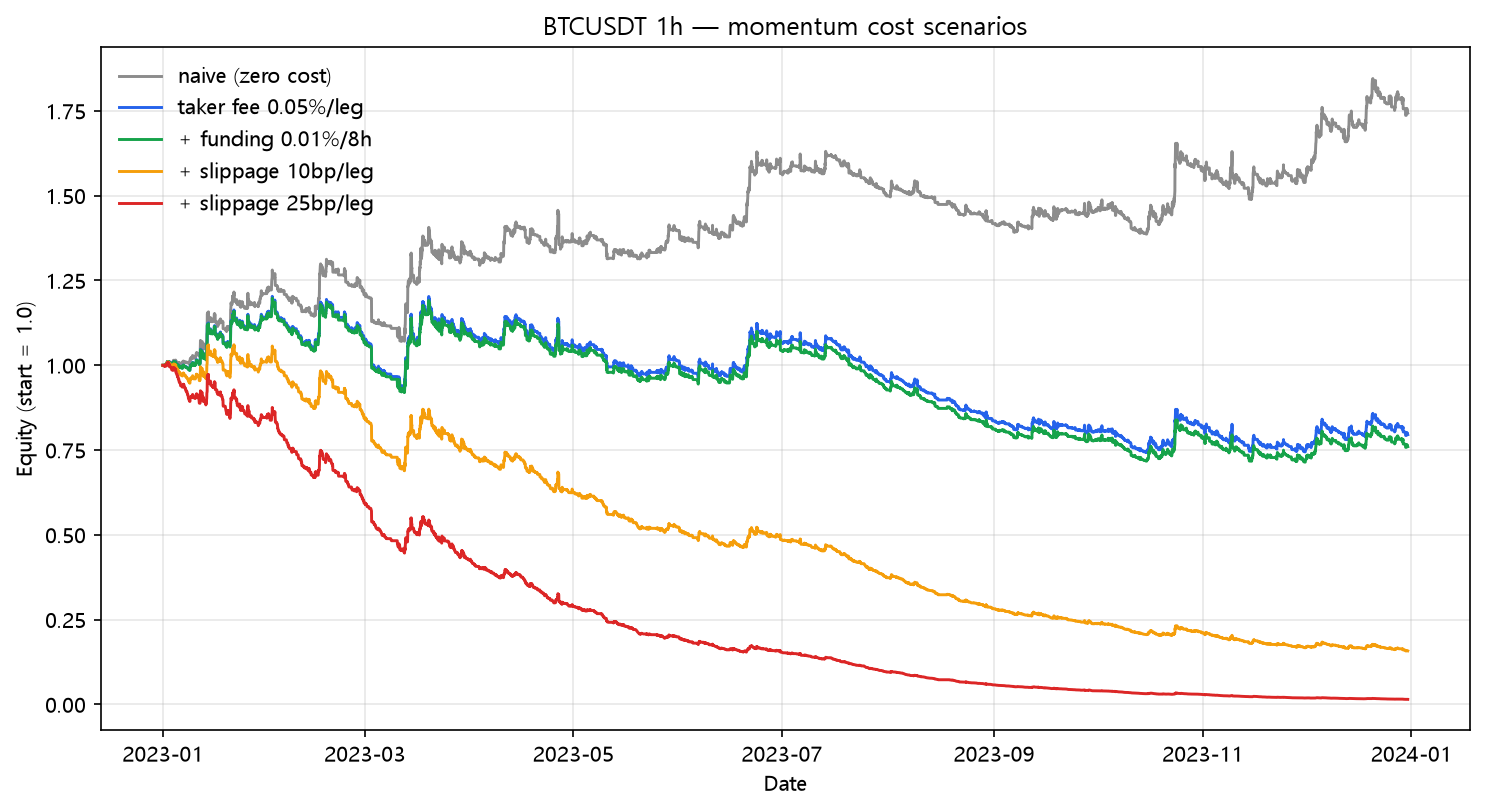
+74.31% → -98.51%. 1,569 legs at 25bp is 98.06% of the account per year — the annual fee bill is larger than the entire account. Only the k-NN (post 18) and ROC (post 31) numbers approach this. Win rate 42.3% (332/785): the strategy was right almost half the time and still died, because at 785 decisions the exchange's cut is a levy on every guess.
What this does NOT prove
- This tests momentum at 10 hourly bars. The academic momentum effect lives at 1–12 months on daily data — my own k-NN and linear-regression posts suggest the longer horizon is the legitimate one. What's dead here is hourly momentum, not momentum.
- A monthly-period momentum strategy on daily bars would trade ~12 times a year and is the natural next experiment — the exact opposite of this post's churn.
- One year, one market: 2023's mean-reverting chops (the spring and fall ranges) are exactly where a 10-bar momentum rule churns worst.
Code
from backtest_base import fetch, backtest_signal, metrics

df = fetch("BTCUSDT", "binance", "2023-01-01", "2023-12-31", "1h")
c = df["close"]

signal = (c > c.shift(10)).fillna(False)
res = backtest_signal(df, signal, cost_per_leg=0.0005,
                      funding_per_bar=0.0001 / 8.0)
print(metrics(res, 8760))
Reproduce it
cd blog-drafts/scripts
python backtest_base.py --strategy momentum --symbol BTCUSDT --interval 1h \
    --start 2023-01-01 --end 2023-12-31 --fee 0.0005 --funding 0.0000125
Data: Binance public API, hourly OHLCV, 8,735 bars. The tables above reproduce exactly from this command.
This is a backtest on historical data, not investment advice. Past performance does not predict future results.