Bollinger Squeeze Backtest on BTC/USDT: +20.97% Net, Volatility Breakout Done Properly
The Bollinger squeeze (bandwidth in the bottom 25%, then upper-band breakout) on real hourly BTC/USDT 2023: +20.97% net, +4.00% at 10bp, 76 trades. Fewer, better-timed entries than plain BB breakout.
Bollinger Squeeze Backtest on BTC/USDT (2023, hourly, real fees)
Post 49 tested a plain Bollinger breakout: buy the close above the upper band, any time. This post tests the squeeze version — buy the close above the upper band only when the bands are unusually tight (bandwidth in the bottom 25% of the last 100 bars). The squeeze is the most popular Bollinger concept on TradingView, and it deserves the comparison. Strategy Lab #60.
The setup
Bandwidth = (upper − lower) / middle. A squeeze means bandwidth < its 100-bar 25th percentile. Long when price closes above the upper band during a squeeze; exit on close back below the middle band. Same engine, same costs.
Results
| Strategy | Category | Total return | CAGR | MaxDD | Sharpe | Trades |
|---|---|---|---|---|---|---|
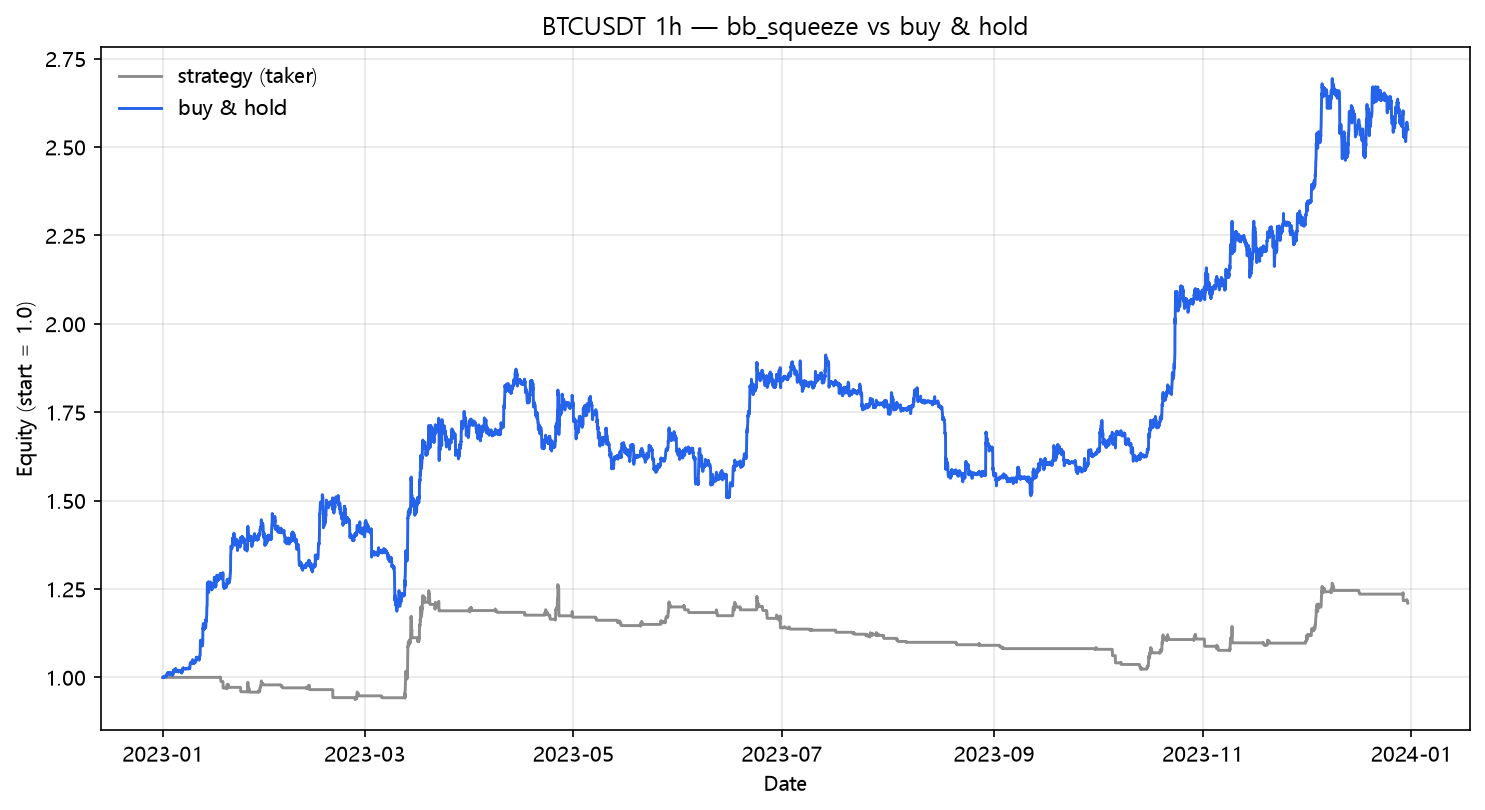
| bb_squeeze | breakout | +20.97% | +20.97% | -19.01% | 1.09 | 76 |
The fee bill
| Scenario | Cost/leg | Total return | MaxDD | Sharpe | Trades | |---|---:|---:|---:|---:|---:|---:| | naive (zero cost) | 0.00% | +32.11% | -15.52% | 1.56 | 76 | | taker fee 0.05%/leg | 0.05% | +22.50% | -18.67% | 1.16 | 76 | | + funding 0.01%/8h | 0.05% | +20.97% | -19.01% | 1.09 | 76 | | + slippage 10bp/leg | 0.15% | +4.00% | -25.12% | 0.30 | 76 | | + slippage 25bp/leg | 0.30% | -17.12% | -34.96% | -0.87 | 76 |
The squeeze cut the plain breakout's 188 trades to 76 — the volatility precondition filters out the endless non-breakouts that the plain rule bought. The reward is a net +20.97% on fewer, higher-conviction entries and a -19.0% drawdown (vs plain breakout's -28.3%). The squeeze is objectively better on this data: less churn, better per-trade edge, better drawdown.
The Bollinger trilogy
| Version | Post | Trades | Naive | Fees+funding | 25bp | MaxDD |
|---|---|---|---|---|---|---|
| Squeeze breakout (this) | — | 76 | +32.11% | +20.97% | -17.12% | -19.01% |
| Plain breakout | 49 | 188 | +60.55% | +29.03% | -49.56% | -28.31% |
| %B reversion | 30 | 112 | +24.93% | +6.71% | -39.11% | -25.79% |
The squeeze sacrifices gross return (+32% vs +60%) to triple the net drawdown efficiency. Three Bollinger personalities, three different shapes, and the ranking falls out exactly as the lab's frequency thesis predicts: the strategy that traded least, made the most per trade.
Why the squeeze works
Bollinger bandwidth is a volatility measure, and low volatility reliably precedes high volatility (volatility clustering). The squeeze waits for the low-vol regime, then demands the breakout in the trend direction. On a year that spent itself trending up, "buy the first push out of quiet" is a better entry than "buy any close above the band." The 76-trade count is the mechanism — it is the entire improvement.
What this does NOT prove
- The 25th-percentile threshold and the 100-bar lookback are arbitrary; more restrictive squeezes trade even less and follow the family pattern, but that's untested.
- The famous "TTM Squeeze" adds a momentum color histogram (John Carter's indicator) — a different, more complex system.
- One pair, one year, one regime.
Code
from backtest_base import fetch, backtest_signal, metrics
from strategy import sig_bb_squeeze

df = fetch("BTCUSDT", "binance", "2023-01-01", "2023-12-31", "1h")
signal = sig_bb_squeeze(df, period=20, num_std=2.0, lookback=100, quantile=0.25)

res = backtest_signal(df, signal, cost_per_leg=0.0005, funding_per_bar=0.0000125)
print(metrics(res, 8760))
Reproduce it
cd blog-drafts/scripts
python gen_post_assets.py --ids 60
Data: Binance public API, hourly OHLCV, 8,735 bars. Tables above reproduce exactly from this command.
This is a backtest on historical data, not investment advice. Past performance does not predict future results.