Bollinger %B Backtest on BTC/USDT: The Walk-Up-From-the-Band Trade vs the Touch Trade
Bollinger %B mean reversion on real hourly BTC/USDT 2023: +24.93% naive, +6.71% with fees/funding, -39.11% at 25bp across 112 trades. Why the entry (walk up from the band) differs from the touch entry of post 11 — and still loses to fees.
Bollinger %B Backtest on BTC/USDT (2023, hourly, real fees)
The Bollinger touch trade — buy the moment price touches the lower band — is what post 11 ran on daily AAPL (+19.27% over eight years, worse drawdown than holding). There's a cleverer variant that traders swear by: wait until price closes back above the lower band, i.e., %B crosses up through 0, and then buy. The logic is that a close above the band means sellers finally failed; you're not catching the knife, you're buying the turn. %B = (close − lower) / (upper − lower), so "crossing 0" is exactly "closing back above the band." I ran that variant on hourly BTC and sold at %B = 1 (upper band). Strategy Lab #30.
Results
| Strategy | Category | Total return | CAGR | MaxDD | Sharpe | Trades |
|---|---|---|---|---|---|---|
| bollinger_pctb | meanrev | +6.71% | +6.73% | -13.32% | 0.39 | 112 |
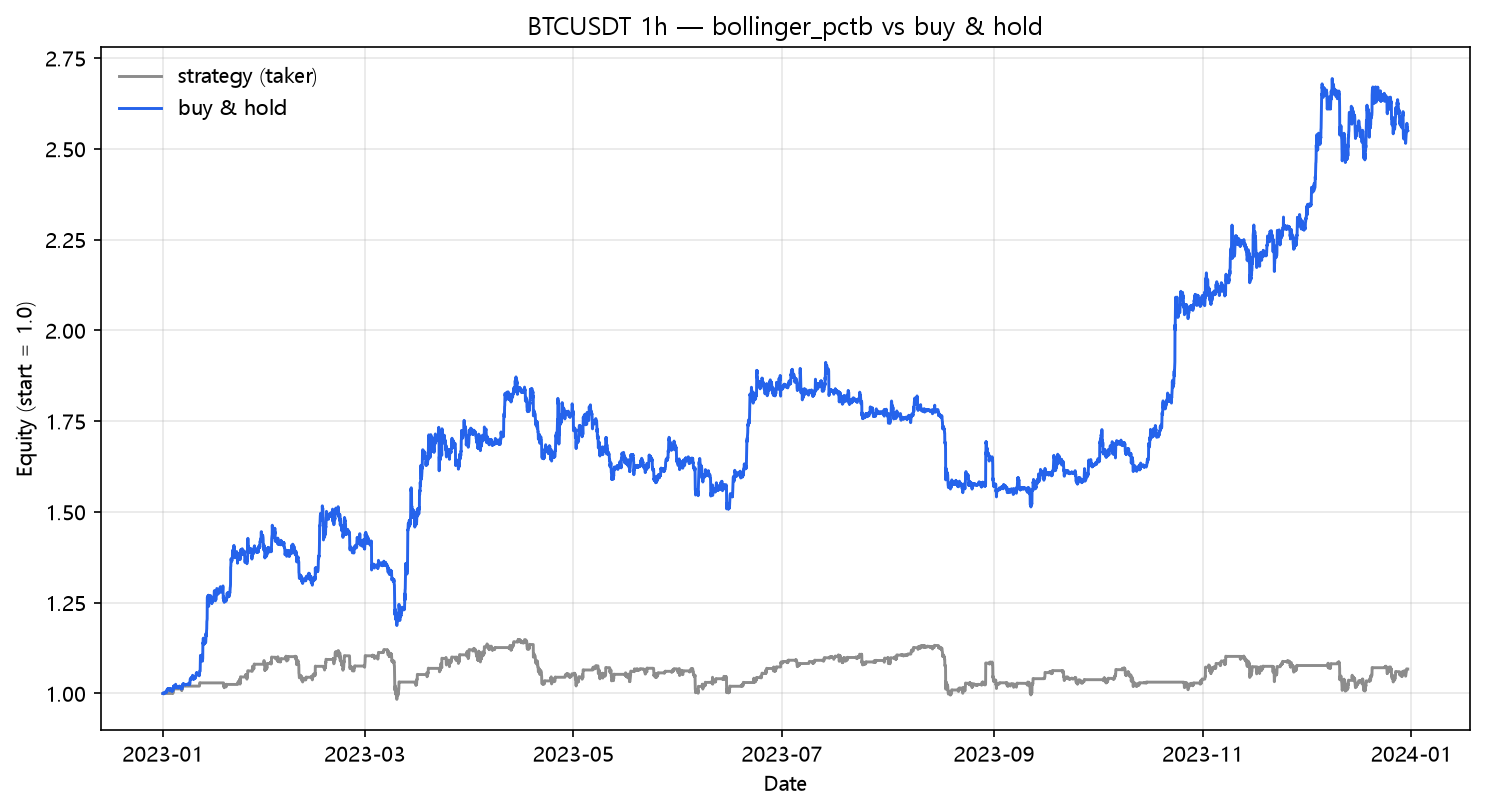
Naive: +24.93% — better than the touch trade would have been on this data, which supports the "wait for the close" school: the entry is later but cleaner, and the drawdown is the tightest in the reversion group (-12.09%). But 112 trades is the giveaway — a strategy that enters after every band-cross and exits at the other band is basically a standing order that gets filled 112 times a year on an hourly tape.
The fee bill
| Scenario | Cost/leg | Total return | MaxDD | Sharpe | Trades | |---|---:|---:|---:|---:|---:|---:| | naive (zero cost) | 0.00% | +24.93% | -12.09% | 1.03 | 112 | | taker fee 0.05%/leg | 0.05% | +11.69% | -12.21% | 0.57 | 112 | | + funding 0.01%/8h | 0.05% | +6.71% | -13.32% | 0.39 | 112 | | + slippage 10bp/leg | 0.15% | -14.73% | -25.26% | -0.52 | 112 | | + slippage 25bp/leg | 0.30% | -39.11% | -44.28% | -1.86 | 112 |
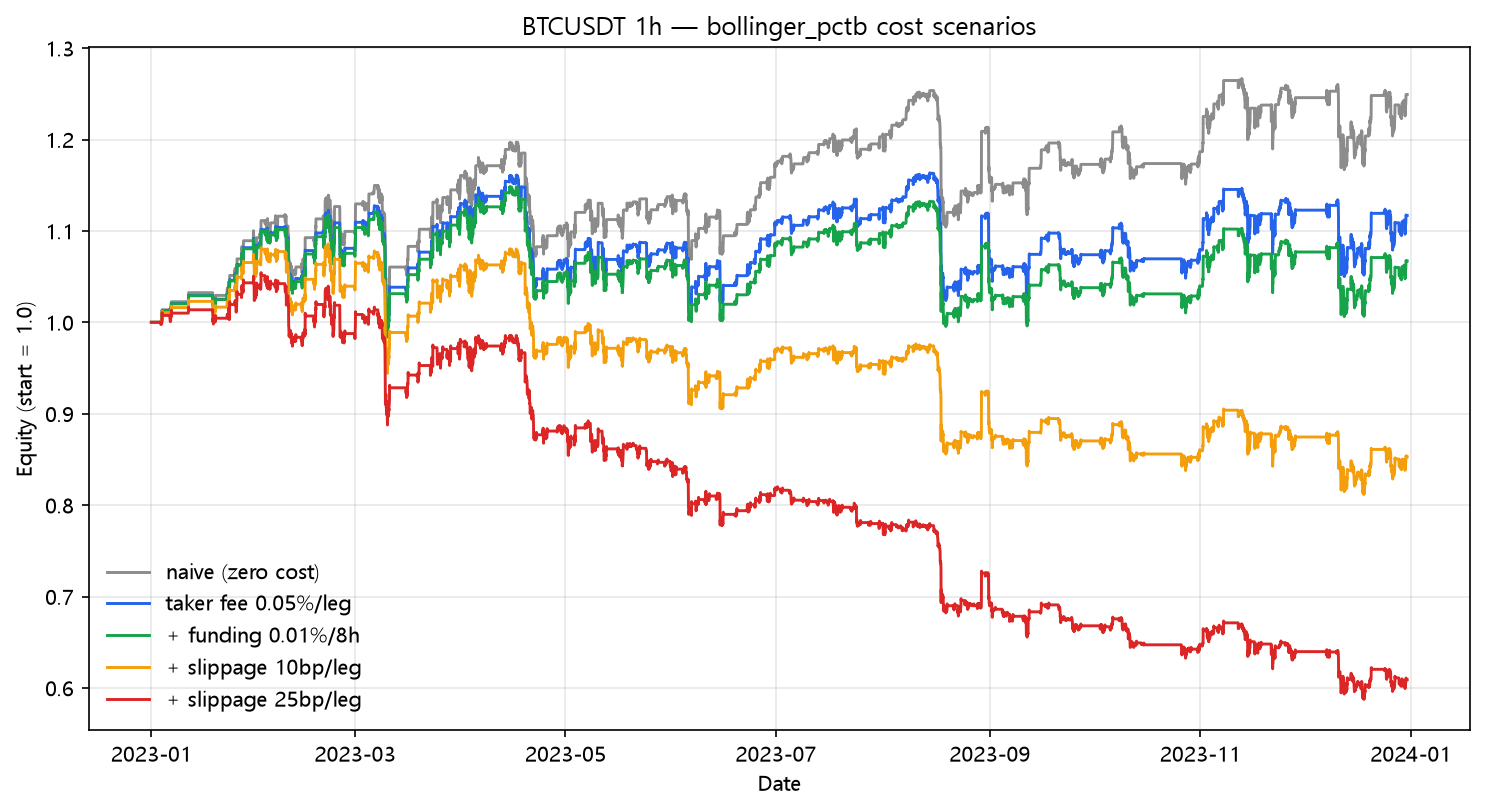
+24.93% → -39.11%. 224 legs at 25bp is 14% of the account per year, and the strategy's edge was only ever ~25 points — so slippage takes the whole thing and then some. Win rate 73.2% (82/112) — the highest in the entire lab — and it still dies at 25bp. This is now the third consecutive reversion post (CCI, MFI, %B) with a 70%+ win rate and a negative worst-case column. The pattern is not a coincidence, it's arithmetic: when your average win is small, cost is a bigger fraction of it.
%B vs the touch trade (same family)
| Variant | Timeframe | Naive | Fees+funding | 25bp |
|---|---|---|---|---|
| Bollinger touch (post 11) | AAPL 1d | +22.78% | +19.27% | +3.15% |
| Bollinger %B (this) | BTC 1h | +24.93% | +6.71% | -39.11% |
The touch trade on daily AAPL survived because it traded 29 times in 8 years. The %B variant on hourly BTC died because it traded 112 times in 1. Same family of logic; the timeframe and frequency decided everything.
What this does NOT prove
- %B reversion with an exit at the middle band (not the upper) is a different, lower-frequency strategy — a natural sensitivity to test.
- One bullish year again: this rule's ideal market is a channel, not a trend.
- The entry improvement (wait for the close) is real and worth keeping; the fee problem is not the entry's fault.
Code
from backtest_base import fetch, backtest_signal, metrics

df = fetch("BTCUSDT", "binance", "2023-01-01", "2023-12-31", "1h")
c = df["close"]
mid = c.rolling(20).mean()
sd  = c.rolling(20).std(ddof=0)
upper, lower = mid + 2*sd, mid - 2*sd
bb = (c - lower) / (upper - lower).replace(0.0, np.nan)

enter = ((bb > 0.0) & (bb.shift(1) <= 0.0)).fillna(False).to_numpy()
exit_ = (bb > 1.0).fillna(False).to_numpy()
position = np.zeros(len(df), dtype=bool)
held = False
for i in range(len(df)):
    if not held and enter[i]:
        held = True
    elif held and exit_[i]:
        held = False
    position[i] = held

signal = pd.Series(position, index=df.index)
res = backtest_signal(df, signal, cost_per_leg=0.0005,
                      funding_per_bar=0.0001 / 8.0)
print(metrics(res, 8760))
Reproduce it
cd blog-drafts/scripts
python backtest_base.py --strategy bollinger_pctb --symbol BTCUSDT --interval 1h \
    --start 2023-01-01 --end 2023-12-31 --fee 0.0005 --funding 0.0000125
Data: Binance public API, hourly OHLCV, 8,735 bars. The tables above reproduce exactly from this command.
This is a backtest on historical data, not investment advice. Past performance does not predict future results.