Bollinger Breakout Backtest on BTC/USDT: The Momentum Twin That Beat the Reversion
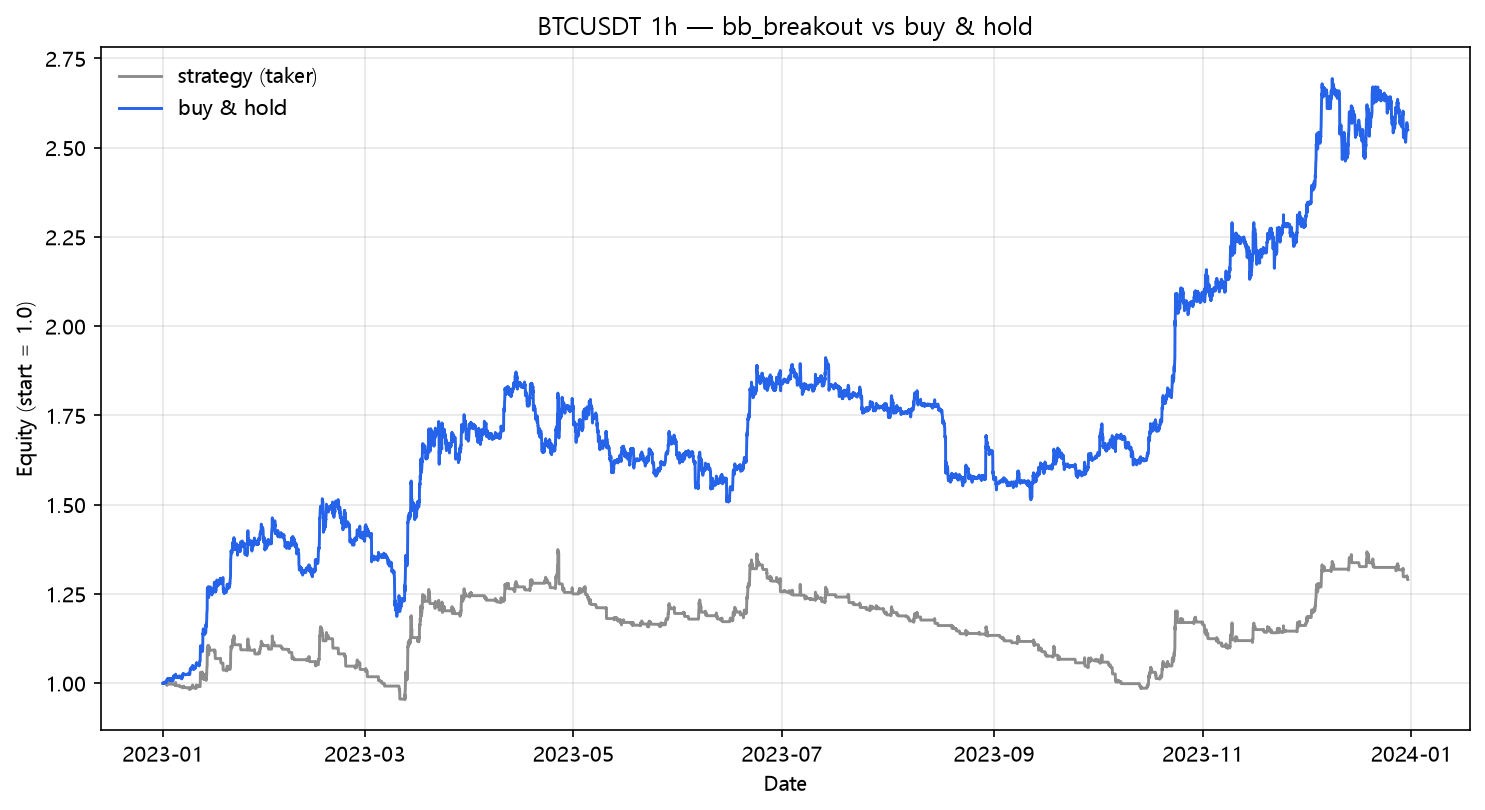
The Bollinger band breakout (momentum) on real hourly BTC/USDT 2023: +29.03% net vs the same bands' reversion at +6.71%. Same indicator, opposite bet, better result — because it traded 188 times instead of 112 with higher per-trade conviction.
Bollinger Breakout Backtest on BTC/USDT (2023, hourly, real fees)
The Bollinger Bands are the rare indicator that spawned two opposite trading philosophies. This lab has already run the reversion side (posts 11, 30). Now the momentum side: instead of buying the dip to the lower band, you buy the close above the upper band and ride it. Same bands, same engine — a head-to-head the indicator itself never gets. Strategy Lab #49.
The setup
Close above the upper band (20, 2σ) → long. Exit on close back below the middle band. Long-only, same cost model, same data.
Results
| Strategy | Category | Total return | CAGR | MaxDD | Sharpe | Trades |
|---|---|---|---|---|---|---|
| bb_breakout | breakout | +29.03% | +29.03% | -28.31% | 1.05 | 188 |
The twin test
| Version | Post | Naive | Fees+funding | 25bp | Trades |
|---|---|---|---|---|---|
| %B reversion (buy the lower band) | [post 30](/blog/bollinger-pctb) | +24.93% | +6.71% | -39.11% | 112 |
| Breakout (buy above the upper band) | this | +60.55% | +29.03% | -49.56% | 188 |
| Bollinger reversion on AAPL | [post 11](/blog/bollinger-aapl) | +22.78% | +19.27% | +3.15% | 29 |
On BTC in a trend year, buying strength beat buying weakness by a wide margin: +29.03% vs +6.71% net. This is the same indicator's two personalities, and the trend personality won the trend year. The deeper reason is the one this lab keeps finding — on a trending tape, "buy the pullback" means buying the middle of every mini-correction; "buy the breakout" means waiting for confirmed strength and paying for it once.
The fee bill
| Scenario | Cost/leg | Total return | MaxDD | Sharpe | Trades | |---|---:|---:|---:|---:|---:|---:| | naive (zero cost) | 0.00% | +60.55% | -22.38% | 1.84 | 188 | | taker fee 0.05%/leg | 0.05% | +33.09% | -27.40% | 1.16 | 188 | | + funding 0.01%/8h | 0.05% | +29.03% | -28.31% | 1.05 | 188 | | + slippage 10bp/leg | 0.15% | -11.35% | -40.73% | -0.29 | 188 | | + slippage 25bp/leg | 0.30% | -49.56% | -56.82% | -2.26 | 188 |
The net return survives real fees — the -11.35% at 10bp is the lab's reminder that "survives fees" and "survives your actual fills" are different sentences. 188 trades is in the danger band (141–300), where this lab's survival rate was a coin flip, and the breakout came out on the right side of the coin.
Where it fits the breakout family
| Strategy | Post | Naive | Fees+funding | 25bp | Trades |
|---|---|---|---|---|---|
| EMA envelope | 24 | +96.69% | +80.99% | +62.11% | 22 |
| BB breakout (this) | — | +60.55% | +29.03% | -49.56% | 188 |
| Donchian (Turtle) | 14 | +44.11% | +24.24% | -21.04% | 91 |
| Keltner | 13 | +39.22% | +21.60% | -30.61% | 112 |
The breakout family ranks exactly by trade count again: the band rule that fires rarely (EMA envelope, 22) dominates the one that fires often (BB, 188). The bands didn't make BB breakout better — its 188 trades made it worse.
What this does NOT prove
- 2σ breakout with a mid-band exit is one parameterization; TTM-style squeeze entry plus a trailing stop is the popular variant and is untested here.
- The reversion side wins range years; this is a trend-year verdict, and the AAPL post-11 result (a mixed 8-year window) already shows the reversion can be the survivor elsewhere.
- One pair, one year, one regime — the standard caveat.
Code
from backtest_base import fetch, backtest_signal, metrics
from strategy import sig_bb_breakout

df = fetch("BTCUSDT", "binance", "2023-01-01", "2023-12-31", "1h")
signal = sig_bb_breakout(df, period=20, num_std=2.0)

res = backtest_signal(df, signal, cost_per_leg=0.0005, funding_per_bar=0.0000125)
print(metrics(res, 8760))
Reproduce it
cd blog-drafts/scripts
python gen_post_assets.py --ids 49
Data: Binance public API, hourly OHLCV, 8,735 bars. Tables above reproduce exactly from this command.
This is a backtest on historical data, not investment advice. Past performance does not predict future results.