Balance of Power Backtest on BTC/USDT: +3.03% Net — the Zero-Cost Illusion, 798 Trades Strong
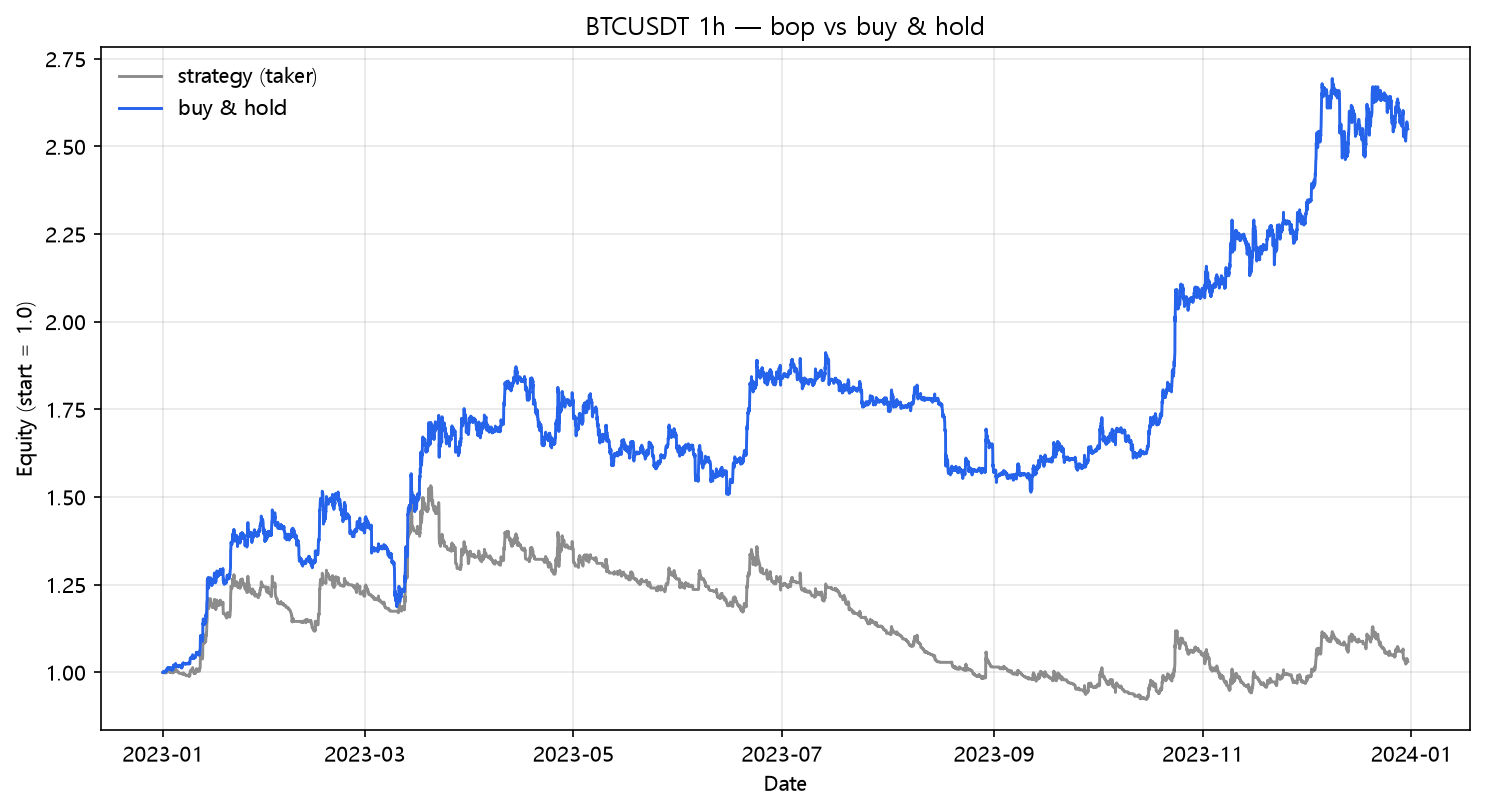
Balance of Power (EMA20 > 0) on real hourly BTC/USDT 2023: +140.76% naive — the best gross in the lab — and +3.03% after fees and funding across 798 trades. The single clearest demonstration that a zero-cost backtest is a fantasy.
Balance of Power Backtest on BTC/USDT (2023, hourly, real fees)
Balance of Power measures each bar's buying pressure — where the close sits within the day's range — and its 20-bar EMA is a classic "buy when bulls are in control" signal. In this lab's five-scenario gauntlet, BOP has the honor of being both the best-looking naive strategy and the most humbling: +140.76% before costs, +3.03% after. No strategy in the series demonstrates the gap between zero-cost and real trading more brutally. Strategy Lab #66.
The setup
BOP = (close − open) / (high − low), averaged over 20 bars. Long when the average is above zero. Same engine, same costs.
Results
| Strategy | Category | Total return | CAGR | MaxDD | Sharpe | Trades |
|---|---|---|---|---|---|---|
| bop | volume | +3.03% | +3.04% | -39.78% | 0.26 | 798 |
The fee bill
| Scenario | Cost/leg | Total return | MaxDD | Sharpe | Trades | |---|---:|---:|---:|---:|---:|---:| | naive (zero cost) | 0.00% | +140.76% | -14.75% | 2.77 | 798 | | taker fee 0.05%/leg | 0.05% | +8.37% | -38.17% | 0.41 | 798 | | + funding 0.01%/8h | 0.05% | +3.03% | -39.78% | 0.26 | 798 | | + slippage 10bp/leg | 0.15% | -79.15% | -82.61% | -4.40 | 798 | | + slippage 25bp/leg | 0.30% | -98.11% | -98.26% | -10.97 | 798 |
Read that naive row carefully: +140.76%, gross Sharpe 2.77, drawdown -14.75% — by those metrics this is one of the two or three best-looking strategies in the entire lab (only the linear-regression trend of post 17 grossed higher, at +199.09%), beating even the envelope and KST. Then the taker fee (0.10% round trip) shaves off 132 points. BOP's problem is not the signal — the bulls-in-control filter genuinely rides the 2023 trend — it is that the signal flips on nearly every bar: 798 round trips. At 25bp it is -98.11%, a total wipeout of even a $100,000 account.
The zero-cost leaderboard, with the fee column
| Strategy | Naive | Fees+funding | Trades |
|---|---|---|---|
| BOP (this) | +140.76% | +3.03% | 798 |
| CCI trend | +134.75% | +85.98% | 178 |
| NVI | +133.09% | +88.16% | 133 |
| KST | +109.28% | +57.40% | 235 |
| EMA | +110.12% | +89.38% | 45 |
BOP has the highest gross in the lab and the second-worst net of the group. The four strategies below it — which look "worse" in a zero-cost backtest — are the ones worth actually running, because their trade counts let them keep 50-80% of their gross. This is the post to bookmark for anyone who backtests without transaction costs: the naive leaderboard is a cost-of-trading map, not an edge ranking.
What this does NOT prove
- A different smoothing (e.g. EMA instead of SMA, or a threshold above 0.05 instead of > 0) would trade less and likely follow the lab's frequency pattern — the mechanism is understood, the specific result is not.
- BOP's divergence use (a common TradingView variant) is a different signal, untested here.
- One pair, one year, one regime.
Code
from backtest_base import fetch, backtest_signal, metrics
from strategy import sig_bop

df = fetch("BTCUSDT", "binance", "2023-01-01", "2023-12-31", "1h")
signal = sig_bop(df, span=20)

res = backtest_signal(df, signal, cost_per_leg=0.0005, funding_per_bar=0.0000125)
print(metrics(res, 8760))
Reproduce it
cd blog-drafts/scripts
python gen_post_assets.py --ids 66
Data: Binance public API, hourly OHLCV, 8,735 bars. Tables above reproduce exactly from this command.
This is a backtest on historical data, not investment advice. Past performance does not predict future results.