Awesome Oscillator Backtest on BTC/USDT: Bill Williams' Median-Price Momentum, With Fees
The Awesome Oscillator (5/34 median SMA) on real hourly BTC/USDT 2023: +84.99% naive, +41.14% with fees/funding, -52.04% at 25bp across 216 trades. How a 31% win rate still produced a positive year.
Awesome Oscillator Backtest on BTC/USDT (2023, hourly, real fees)
Bill Williams' Awesome Oscillator subtracts the 34-bar SMA of the median price from the 5-bar SMA of the median price. It's momentum without the closing price — no close, no RSI-style smoothing, just "is the recent midpoint average above the longer one." The traditional rule is long when the oscillator is above zero. I ran it on hourly BTC/USDT, and it made +41.14% after fees and funding in 2023 with a 31% win rate. Let that sink in: a strategy that lost more than two-thirds of its trades made real money, because the median-price swing is wide enough that its winners were enormous. Strategy Lab #34.
Results
| Strategy | Category | Total return | CAGR | MaxDD | Sharpe | Trades |
|---|---|---|---|---|---|---|
| awesome | momentum | +41.14% | +41.28% | -28.49% | 1.20 | 216 |
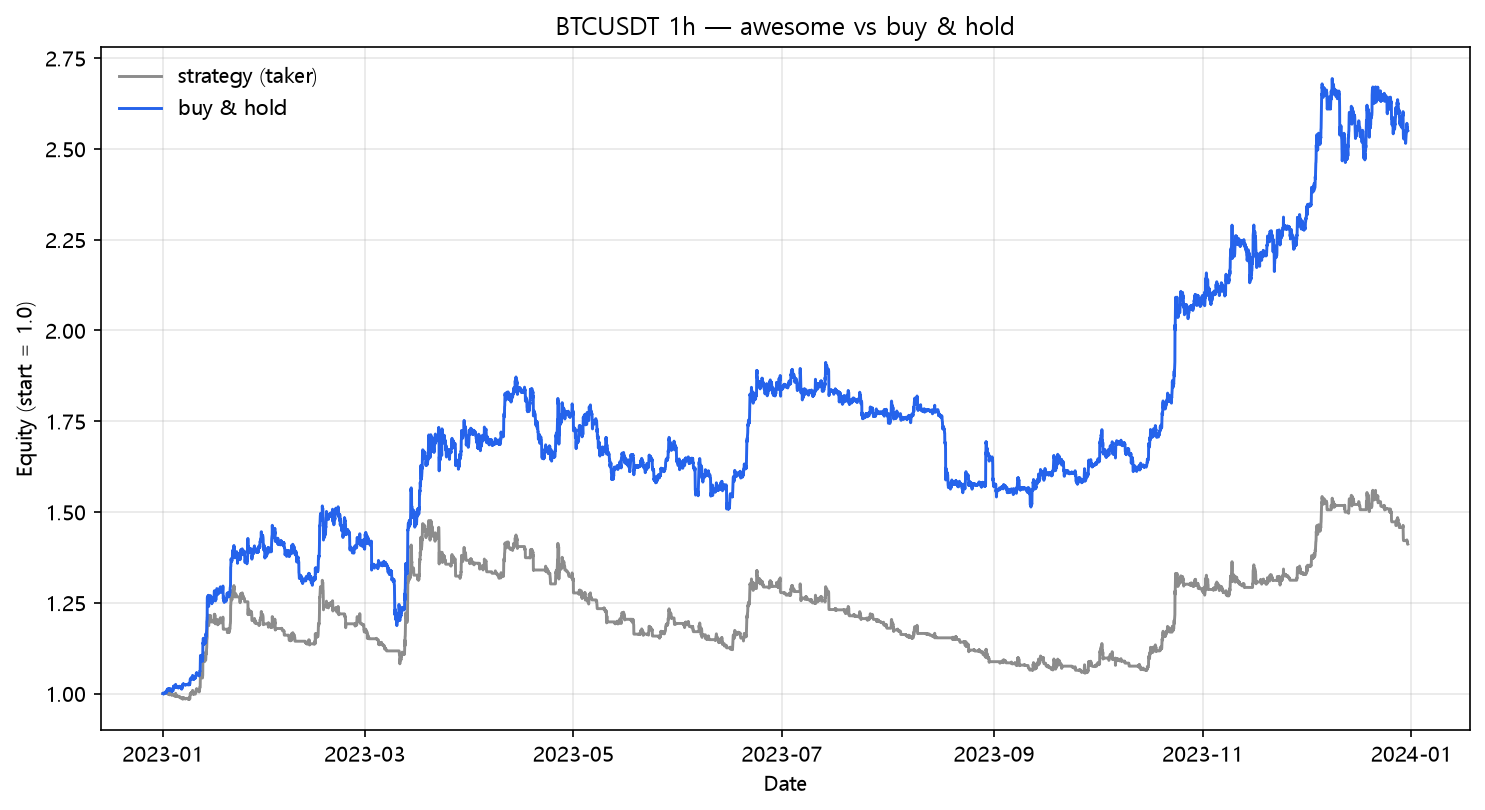
Naive: +84.99% with a Sharpe of 2.01. The interesting column is win rate: 67 of 216, just 31.0%. Most trades were small losers as the oscillator crossed zero in chop; the profits came from a handful of median-price legs that ran for days. That's the low-hit/high-payoff distribution that trend-following needs — and it worked well enough to stay positive through taker fees and funding.
The fee bill
| Scenario | Cost/leg | Total return | MaxDD | Sharpe | Trades | |---|---:|---:|---:|---:|---:|---:| | naive (zero cost) | 0.00% | +84.99% | -18.92% | 2.01 | 216 | | taker fee 0.05%/leg | 0.05% | +49.12% | -26.59% | 1.36 | 216 | | + funding 0.01%/8h | 0.05% | +41.14% | -28.49% | 1.20 | 216 | | + slippage 10bp/leg | 0.15% | -8.32% | -44.50% | -0.09 | 216 | | + slippage 25bp/leg | 0.30% | -52.04% | -64.05% | -1.99 | 216 |
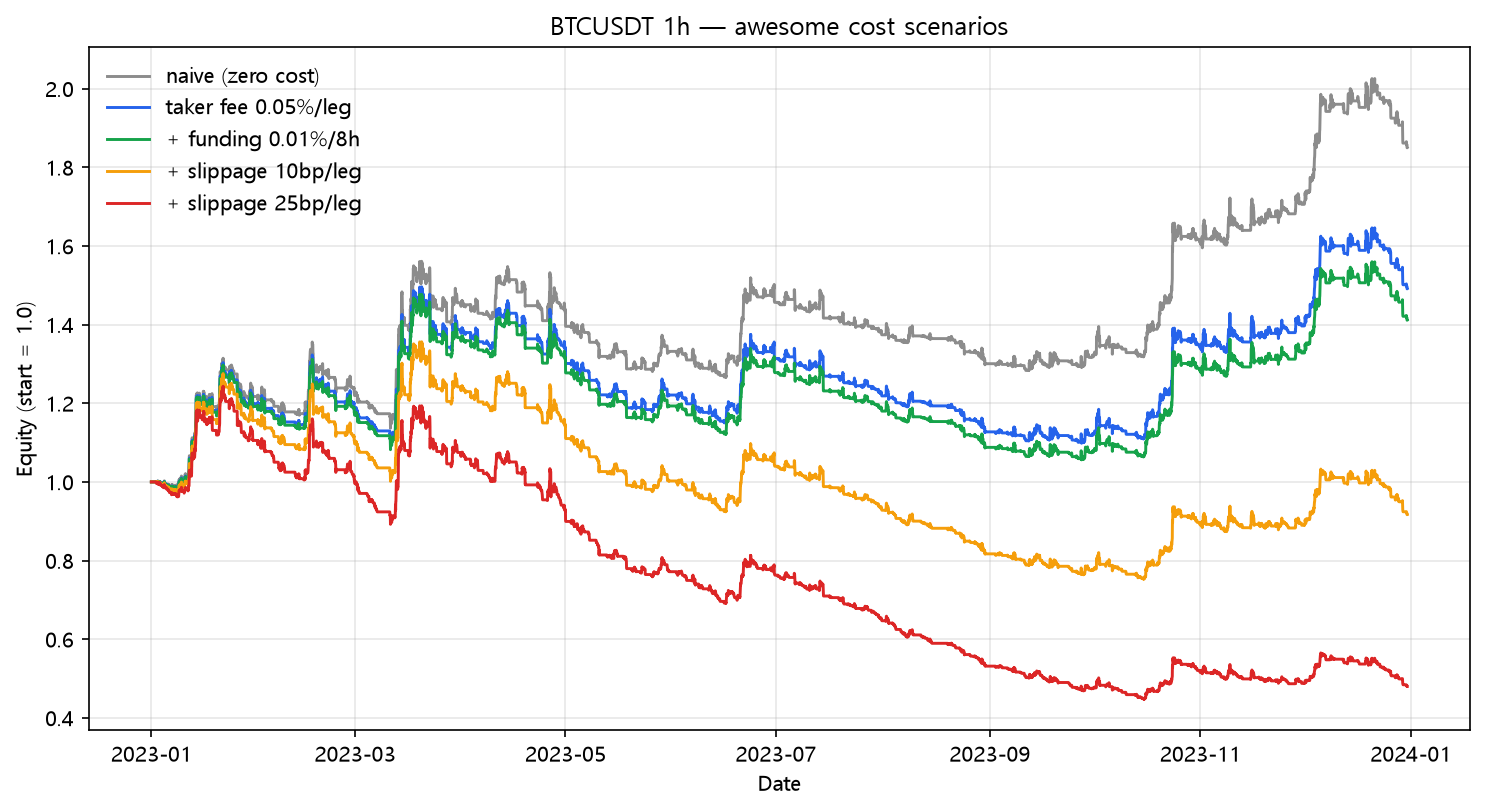
+84.99% → -52.04%. 431 legs at 25bp is ~27% of the account per year, and the strategy's gross edge (~85 points) can't survive a 27-point annual tax plus the slippage on its losers. The pattern repeats from TRIX (post 32): positive at fees, dead by 25bp. The oscillator's 31% win rate is worth emphasizing because it's the anti-Aroon: Aroon (post 23) won 66.8% of the time and made less honest money than this. Win rate is not the product.
The frequency ladder (momentum, hourly BTC, 2023)
| Strategy | Trades | Win rate | Naive | Fees+funding | 25bp |
|---|---|---|---|---|---|
| TRIX (post 32) | 201 | 44.8% | +111.94% | +64.74% | -39.65% |
| Awesome (this) | 216 | 31.0% | +84.99% | +41.14% | -52.04% |
| MACD (post 15) | 333 | — | +79.08% | +22.21% | -76.89% |
| Force Index (post 33) | 507 | 38.3% | +43.34% | -17.50% | -93.47% |
Same family, same engine, one variable changing: trade count. The ranking of every column tracks the first column. This is the cleanest demonstration in the lab that frequency, not indicator cleverness, decides who survives.
What this does NOT prove
- The "zero line" rule is the basic one; Williams' own setups add the "twin peaks" and saucer patterns, which are discretionary and impossible to test fairly here.
- Median price (high+low)/2 ignores volume and close — intentional, but it means gap-heavy candles behave oddly.
- 2023 again: one year, one regime. The 31% win rate needs the big winners to keep coming; a year without them is a -50% year at fees alone.
Code
from backtest_base import fetch, backtest_signal, metrics

df = fetch("BTCUSDT", "binance", "2023-01-01", "2023-12-31", "1h")
m = (df["high"] + df["low"]) / 2.0
ao = m.rolling(5).mean() - m.rolling(34).mean()

signal = (ao > 0.0).fillna(False)
res = backtest_signal(df, signal, cost_per_leg=0.0005,
                      funding_per_bar=0.0001 / 8.0)
print(metrics(res, 8760))
Reproduce it
cd blog-drafts/scripts
python backtest_base.py --strategy awesome --symbol BTCUSDT --interval 1h \
    --start 2023-01-01 --end 2023-12-31 --fee 0.0005 --funding 0.0000125
Data: Binance public API, hourly OHLCV, 8,735 bars. The tables above reproduce exactly from this command.
This is a backtest on historical data, not investment advice. Past performance does not predict future results.