Vortex Indicator Backtest on BTC/USDT: When a Trend Strategy Trades Like a Market Maker
The Vortex indicator (VI+ vs VI-) as a long-only strategy on real hourly BTC/USDT 2023: +93.92% naive but only +6.59% with fees and funding, -93.17% at 25bp. 549 trades and what they teach about range detection.
Vortex Indicator Backtest on BTC/USDT (2023, hourly, real fees)
Every indicator has a moment where it feels like it understands the market, and the Vortex had two of them for me. First, the math: VI+ measures how far up-range moved relative to true range, VI− measures down-range, and the cross of the two is supposed to mark trend direction changes. Second, the chart: in the spring trend of 2023, VI+ sat above VI− for weeks, riding what looked like perfect conviction. Then the fee model ran, and the strategy that had felt so directional turned out to be a market maker in disguise — 549 round trips in one year. Strategy Lab #25.
The setup
Long when VI+(14) > VI−(14). For each bar, VI+ = sum(|high − low_prev|) / sum(TR) over 14 bars; VI− = sum(|low − high_prev|) / sum(TR). It's a legitimate range-expansion measure, the same family as the Directional Movement the ADX uses (post 06). The catch is that on an hourly tape, up-range and down-range trade the lead back and forth many times a day. "Trend direction" by this measure flipped 549 times.
Results
| Strategy | Category | Total return | CAGR | MaxDD | Sharpe | Trades |
|---|---|---|---|---|---|---|
| vortex | trend | +6.59% | +6.61% | -34.08% | 0.36 | 549 |
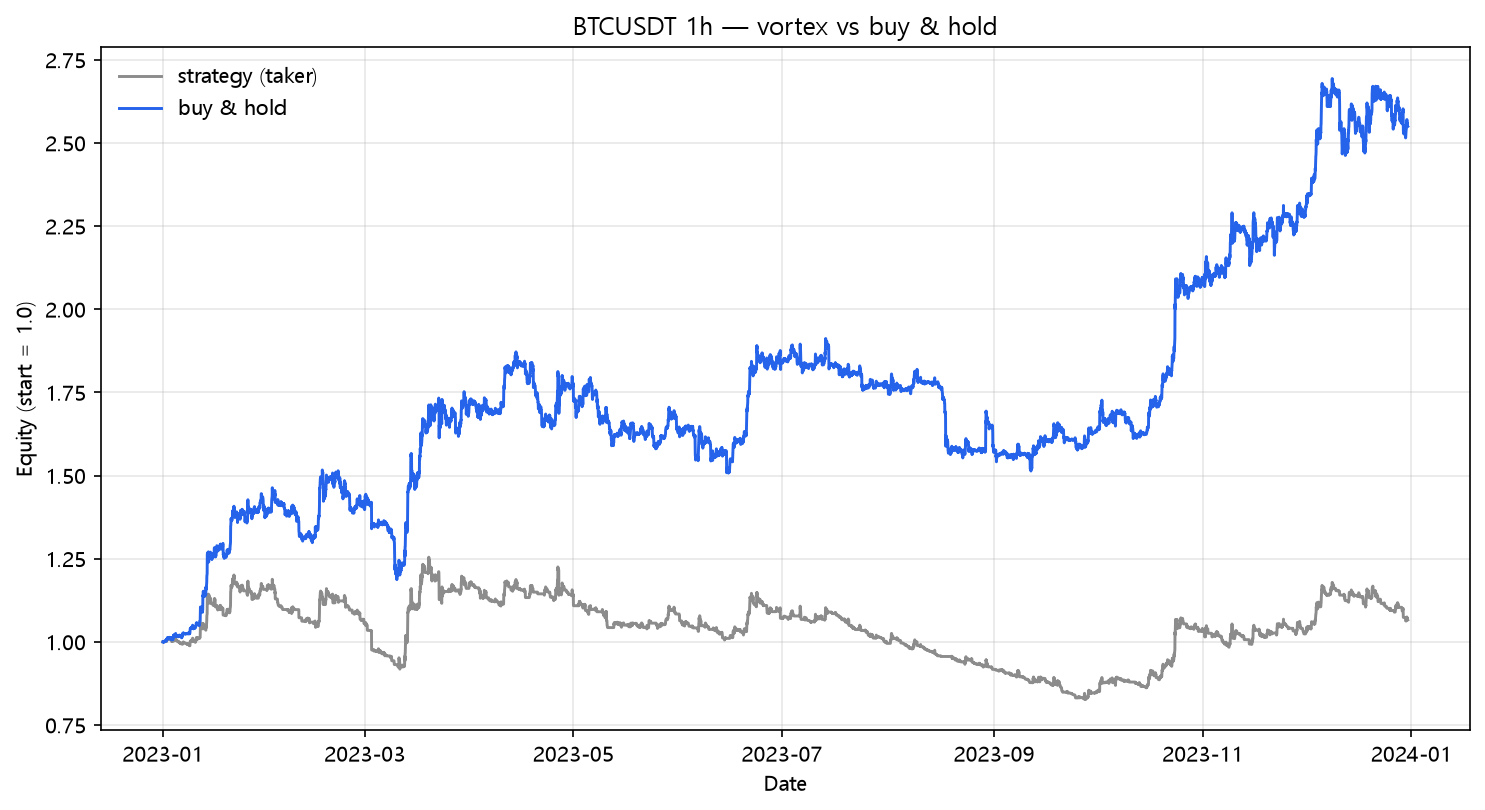
Naive Vortex made +93.92% — a number that would look great in a screenshot and means almost nothing. The zero-cost fantasy and the fee reality are different strategies here: same signals, but the cost model takes 549 round trips to the cashier. The honest result, +6.59% on a year the underlying rose 154.94%, is a strategy that spent all year running in place.
The fee bill
| Scenario | Cost/leg | Total return | MaxDD | Sharpe | Trades | |---|---:|---:|---:|---:|---:|---:| | naive (zero cost) | 0.00% | +93.92% | -17.78% | 2.18 | 549 | | taker fee 0.05%/leg | 0.05% | +12.03% | -32.44% | 0.51 | 549 | | + funding 0.01%/8h | 0.05% | +6.59% | -34.08% | 0.36 | 549 | | + slippage 10bp/leg | 0.15% | -64.45% | -68.43% | -2.94 | 549 | | + slippage 25bp/leg | 0.30% | -93.17% | -93.30% | -7.66 | 549 |
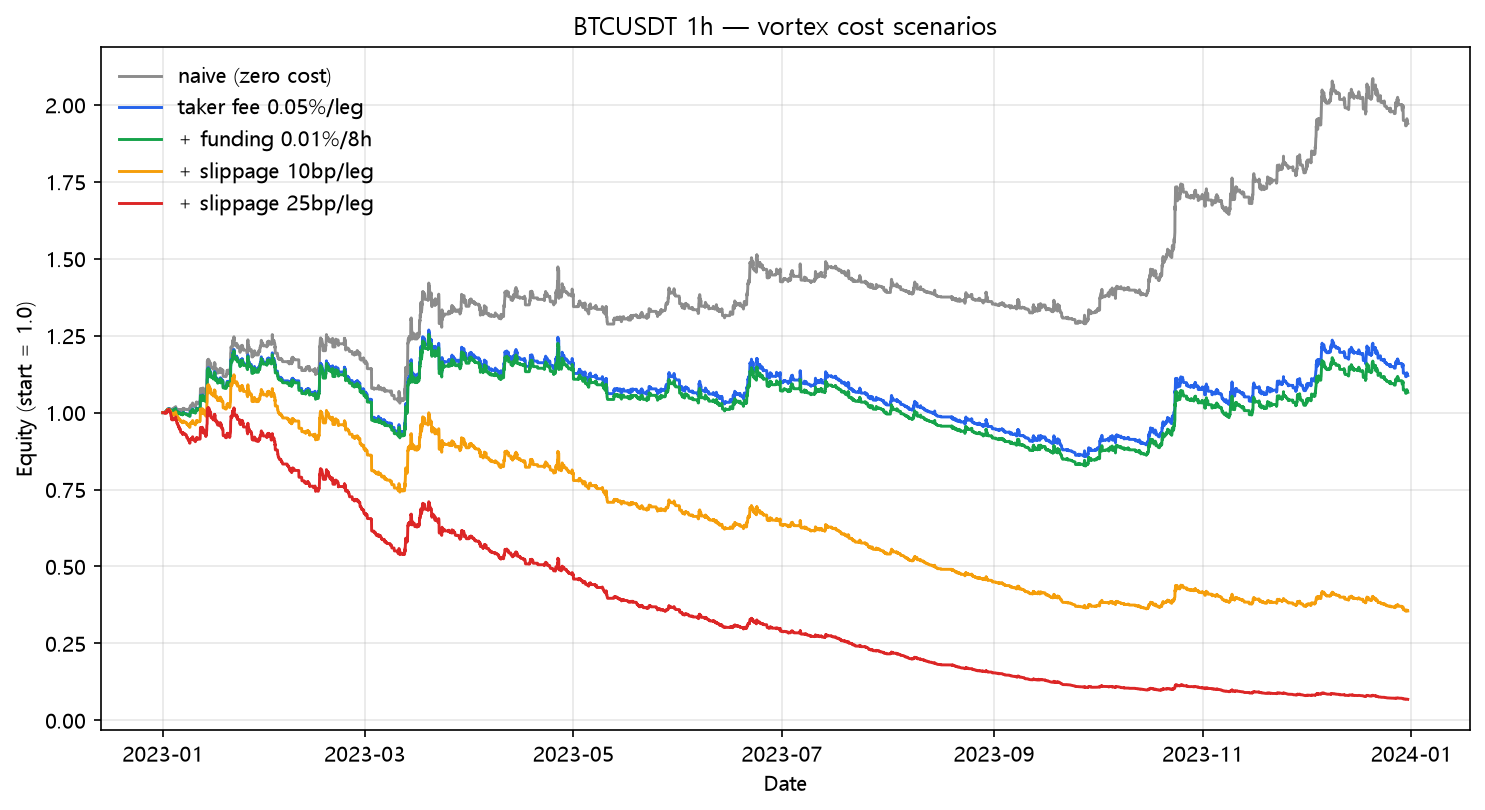
+93.92% → -93.17%. The fastest collapse yet recorded in this lab for a strategy that started in nine figures. 1,097 legs at 25bp is 68.56% of the account per year — the annual cost alone exceeds what most strategies manage to return. The win rate was 42.3% (232/549), which for 549 trades is just noise. What the Vortex measures — range expansion — is real; what it cannot do is decide when that expansion is tradable, so it trades all of it.
What this does NOT prove
- The Vortex is commonly used as a confirmation overlay, not a standalone switch. Long-only + "VI+ above" is the harshest possible reading of the indicator's intent.
- A slower parameter (14 → 21 or 34) or a daily timeframe would cut the churn dramatically; this is the hourly worst case, deliberately.
- 549 trades is a frequency problem wearing a trend-indicator costume. The indicator isn't broken; the pairing is.
Code
from backtest_base import fetch, backtest_signal, metrics

df = fetch("BTCUSDT", "binance", "2023-01-01", "2023-12-31", "1h")
tr = pd.concat([df["high"] - df["low"],
                (df["high"] - df["close"].shift()).abs(),
                (df["low"] - df["close"].shift()).abs()], axis=1).max(axis=1)
vm_plus  = (df["high"] - df["low"].shift()).abs()
vm_minus = (df["low"] - df["high"].shift()).abs()
vi_plus  = vm_plus.rolling(14).sum() / tr.rolling(14).sum()
vi_minus = vm_minus.rolling(14).sum() / tr.rolling(14).sum()

signal = (vi_plus > vi_minus).fillna(False)
res = backtest_signal(df, signal, cost_per_leg=0.0005,
                      funding_per_bar=0.0001 / 8.0)
print(metrics(res, 8760))
Reproduce it
cd blog-drafts/scripts
python backtest_base.py --strategy vortex --symbol BTCUSDT --interval 1h \
    --start 2023-01-01 --end 2023-12-31 --fee 0.0005 --funding 0.0000125
Data: Binance public API, hourly OHLCV, 8,735 bars. The tables above reproduce exactly from this command.
This is a backtest on historical data, not investment advice. Past performance does not predict future results.