Ultimate Oscillator Backtest on BTC/USDT: Five Trades, +21.43% Even at 25bp
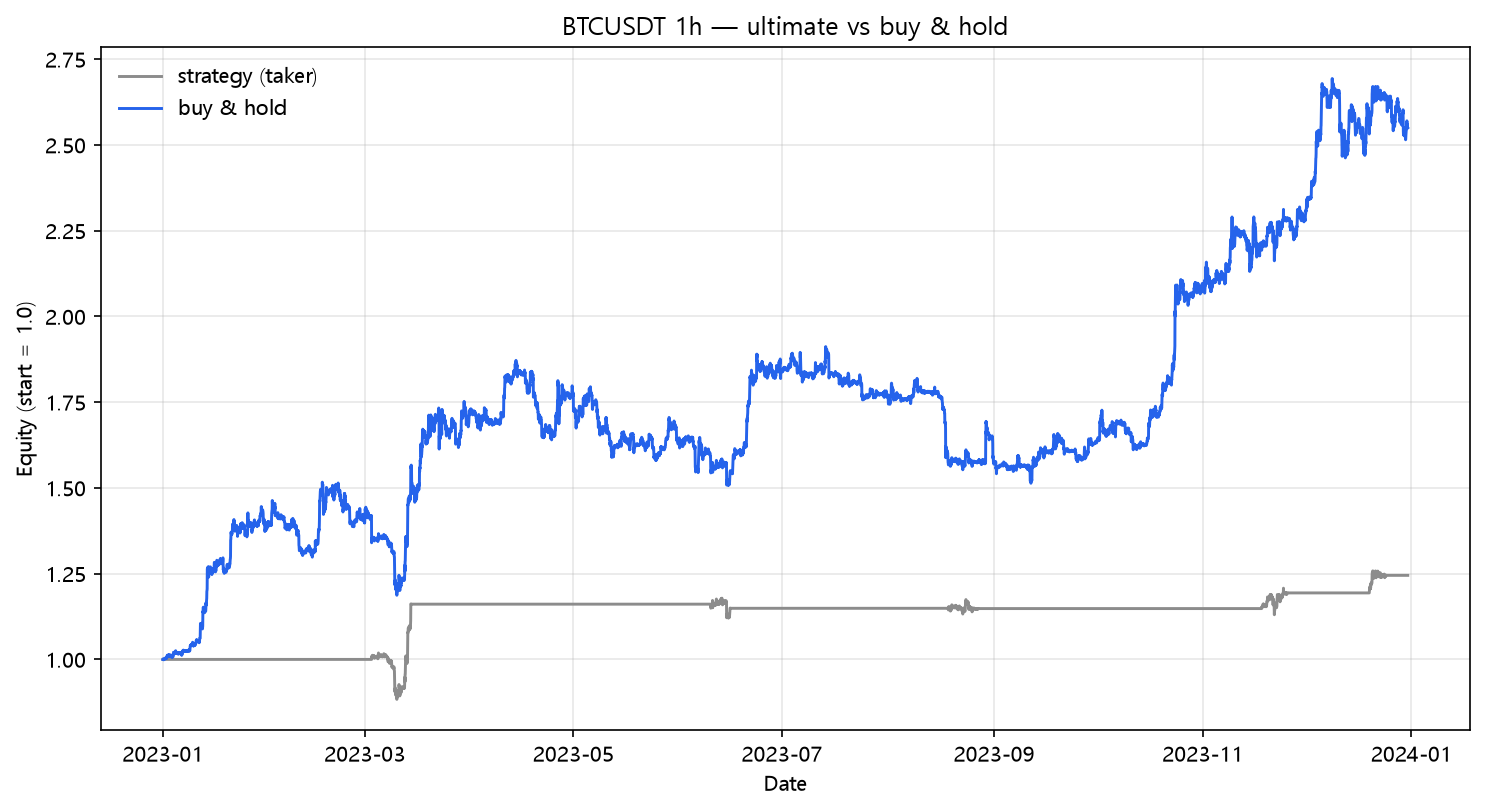
The Ultimate Oscillator (7/14/28) on real hourly BTC/USDT 2023 made 5 trades and returned +24.51% net — the only mean reversion in the lab that stayed positive at 25bp (+21.43%). The case for doing almost nothing.
Ultimate Oscillator Backtest on BTC/USDT (2023, hourly, real fees)
Every post in this lab has been about cost — how the fee bill eats the gross edge. The Ultimate Oscillator is the exception that proves the rule, in the most literal way possible: it traded five times all year. It made +24.51% net, survived 25bp slippage, and its entire argument is the trade count you can count on one hand. Strategy Lab #48.
The setup
The Ultimate Oscillator (Larry Williams) averages buying pressure over three timeframes — 7, 14, and 28 bars, weighted 4/2/1 — precisely so that no single lookback can dominate. The reversion rule: buy when UO falls below 30, exit when it closes back above 70. Same engine, same costs.
Results
| Strategy | Category | Total return | CAGR | MaxDD | Sharpe | Trades |
|---|---|---|---|---|---|---|
| ultimate | meanrev | +24.51% | +24.51% | -13.29% | 1.53 | 5 |
The fee bill (read it twice)
| Scenario | Cost/leg | Total return | MaxDD | Sharpe | Trades | |---|---:|---:|---:|---:|---:|---:| | naive (zero cost) | 0.00% | +26.57% | -13.15% | 1.64 | 5 | | taker fee 0.05%/leg | 0.05% | +25.94% | -13.15% | 1.61 | 5 | | + funding 0.01%/8h | 0.05% | +24.51% | -13.29% | 1.53 | 5 | | + slippage 10bp/leg | 0.15% | +23.27% | -13.29% | 1.46 | 5 | | + slippage 25bp/leg | 0.30% | +21.43% | -13.29% | 1.36 | 5 |
Ten legs, total cost at 25bp = three percentage points, and the strategy doesn't care. UO joins the MA family (posts 01, 03, 19, 22, 24, and Bollinger's AAPL run in post 11) as one of the few entries in the entire 45-post lab that stays positive at 25bp — and it is the only mean reversion on BTC to do it. Its -13.3% max drawdown is the best of any BTC strategy tested.
Why the five trades
UO < 30 is a deep oversold condition, and on a +155% trend year it almost never fires — the three-timeframe average resists the brief hourly dips that single-period oscillators grab at. RSI(2) treats every -3% hour as an entry; UO only notices the days that actually matter. Five trades in, the five biggest reversion opportunities of the year were identified and each one snapped back. That is the mean-reversion thesis working as designed — it just works best when it almost never acts.
The honest asterisk
Five trades is not a statistically meaningful sample. The +24.51% is one year of luck, skill, and regime interacting, and you cannot separate them at n=5. The correct reading of this post is not "trade UO" — it's the confirmation of the lab's central result: every cost in this series is a per-trade tax, and the strategy that pays the least tax is the one that barely trades. UO is the reversion family's living proof, and the caveat is that it may just be five lucky trades.
Code
from backtest_base import fetch, backtest_signal, metrics
from strategy import sig_ultimate

df = fetch("BTCUSDT", "binance", "2023-01-01", "2023-12-31", "1h")
signal = sig_ultimate(df, p1=7, p2=14, p3=28)

res = backtest_signal(df, signal, cost_per_leg=0.0005, funding_per_bar=0.0000125)
print(metrics(res, 8760))
Reproduce it
cd blog-drafts/scripts
python gen_post_assets.py --ids 48
Data: Binance public API, hourly OHLCV, 8,735 bars. Tables above reproduce exactly from this command.
This is a backtest on historical data, not investment advice. Past performance does not predict future results.