TEMA Crossover Backtest on BTC/USDT: The Best Trend Result in the Lab So Far
The TEMA (triple exponential moving average) crossover on real hourly BTC/USDT 2023: +116.28% naive, +83.49% with fees and funding, still +4.45% at 25bp. The strongest risk-adjusted trend result in the series — but the slippage cliff is real.
TEMA Crossover Backtest on BTC/USDT (2023, hourly, real fees)
Here's the honest scoreboard moment I have been waiting for: the TEMA crossover just posted the best Sharpe in the entire Strategy Lab series so far — 2.11 with taker fees and funding, and 2.64 before costs. On real hourly BTC/USDT data. That's the triple exponential moving average doing what its marketing promises: staying responsive enough to ride moves while being smooth enough not to trade them to death. Strategy Lab #20.
What TEMA actually is
TEMA = 3·EMA − 3·EMA(EMA) + EMA(EMA(EMA)). It's the DEMA idea taken one round further: triple-smoothing removes most of the lag penalty that normally comes with slow averages, so a 120-period TEMA still turns reasonably quickly. My setup is the usual fast/slow pair — TEMA(24) vs TEMA(120) — long when the fast line is above.
In 2023 the strategy made 113 trades. Compare DEMA's 78 (post 19) and the plain EMA's 45 (post 01) — TEMA is the most active of the three, because TEMA's faster response catches both earlier entries and earlier exits, which is exactly the double-edged behavior to watch on a choppy tape.
Results
| Strategy | Category | Total return | CAGR | MaxDD | Sharpe | Trades |
|---|---|---|---|---|---|---|
| tema_cross | trend | +83.49% | +83.81% | -22.90% | 2.11 | 113 |
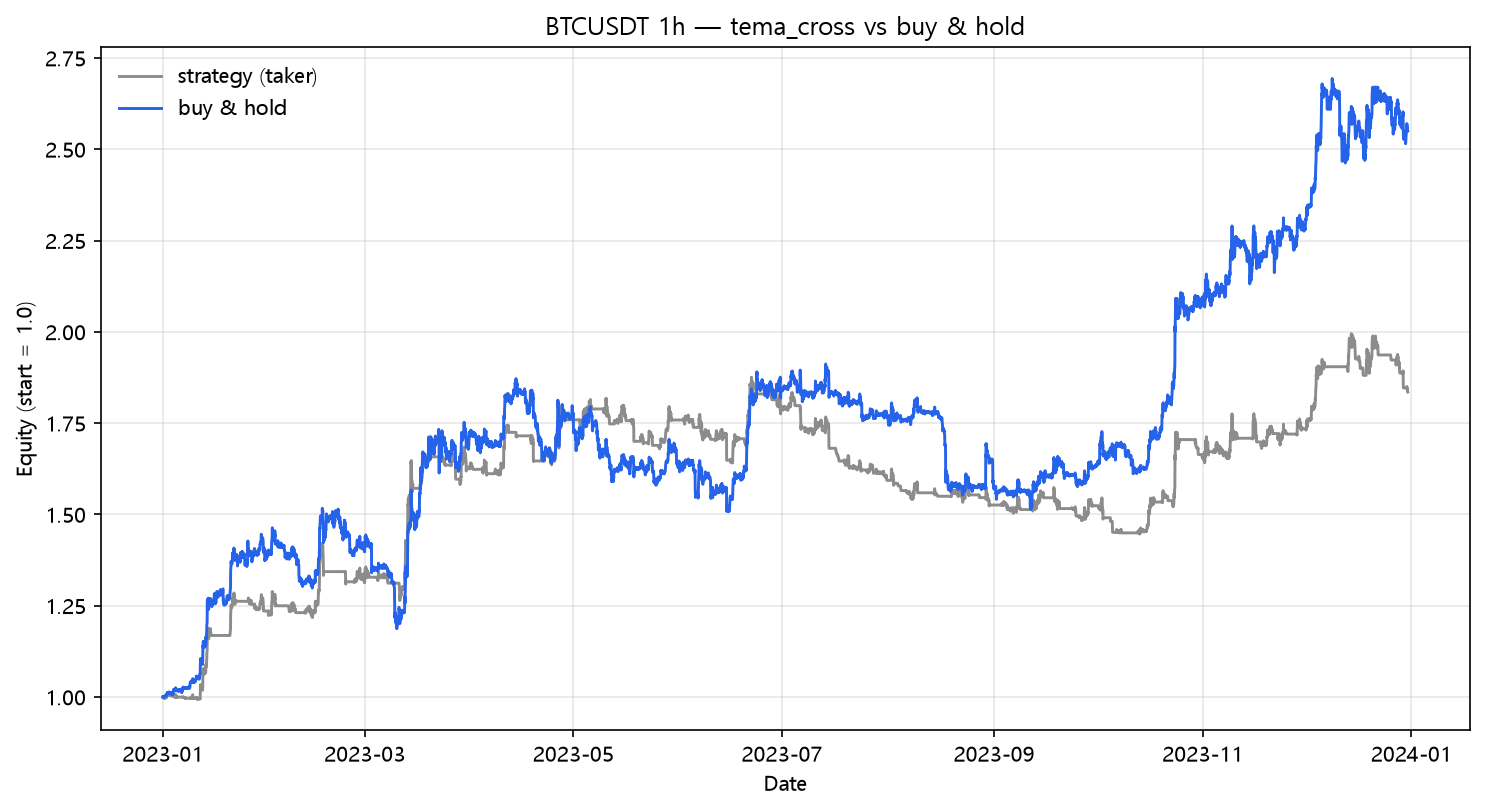
Naive TEMA makes +116.28% — closer to buy & hold's +154.94% than any trend strategy I've run so far, with a smaller drawdown (-18.48% vs -21.74%). The catch is that 113 trades = 225 legs, and the fee bill below shows exactly what a year of trend trading costs.
The fee bill
| Scenario | Cost/leg | Total return | MaxDD | Sharpe | Trades | |---|---:|---:|---:|---:|---:|---:| | naive (zero cost) | 0.00% | +116.28% | -18.48% | 2.64 | 113 | | taker fee 0.05%/leg | 0.05% | +93.26% | -21.68% | 2.28 | 113 | | + funding 0.01%/8h | 0.05% | +83.49% | -22.90% | 2.11 | 113 | | + slippage 10bp/leg | 0.15% | +46.49% | -28.83% | 1.38 | 113 | | + slippage 25bp/leg | 0.30% | +4.45% | -39.84% | 0.30 | 113 |
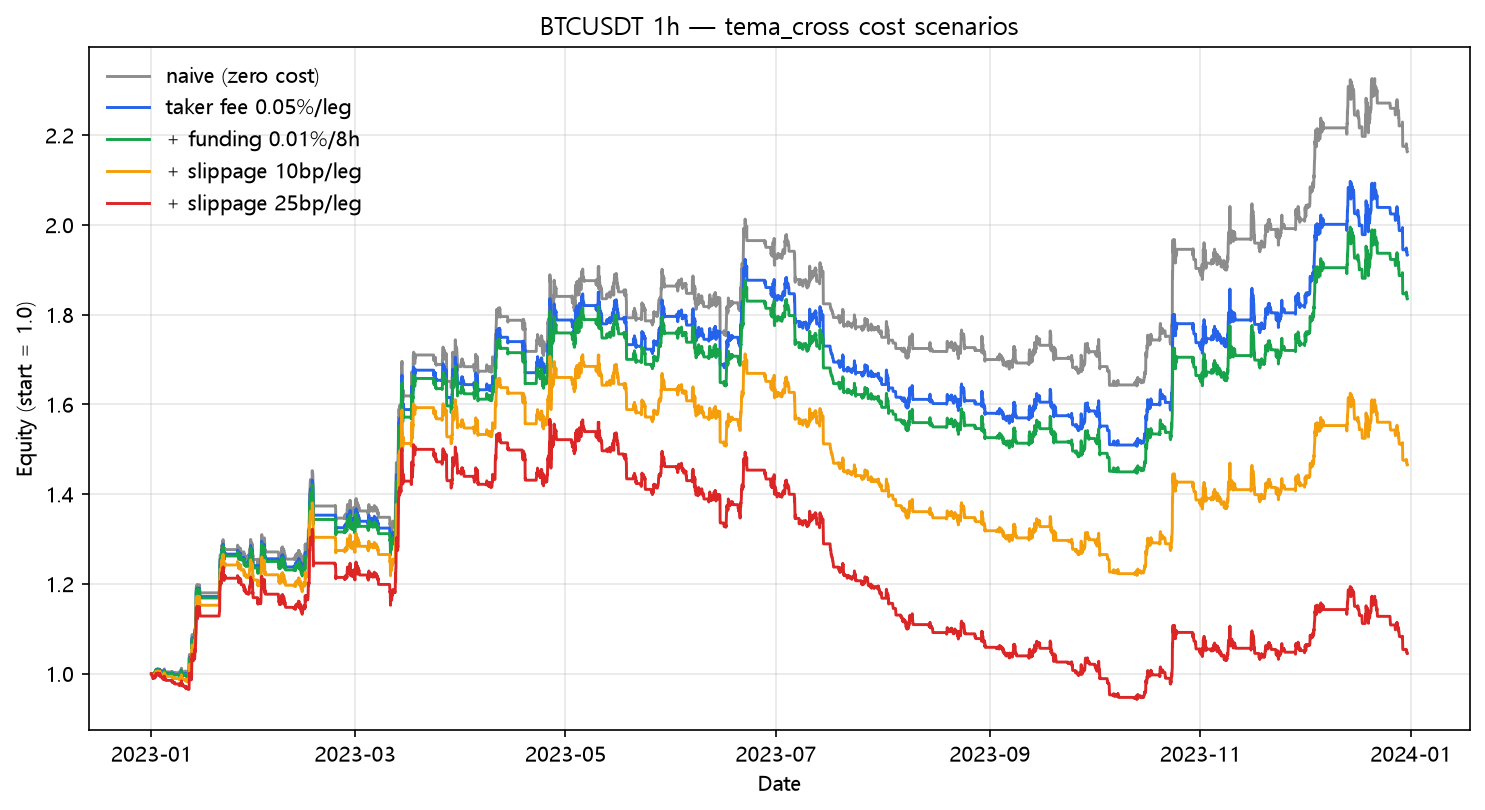
+116.28% → +4.45%. The positive run survives five cost columns, which is rare in this lab — most strategies go negative before the last column. But look at the shape of the cliff: the 25bp column eats 79 points of return in one step. 225 legs at an extra 20bp each is 45% of principal in slippage. TEMA wins because it trades rarely; it still almost loses because it trades at all. Win rate was 41.6% (47/113) — a low-hit-rate, high-payoff profile that requires the few big winners to be very big.
What this does NOT prove
- 2023 was a strong BTC year; a trend strategy that catches the run early looks like a genius. The same TEMA on a flat year would post a far humbler table.
- The 25bp column is the honest one for anyone market-ordering on Binance during choppy liquidity. The real takeaway: even the best trend strategy in the series is one slippage decision away from breakeven.
- Parameter 24/120 is one point in a grid. A wide sensitivity scan (post 41 in the series covers this) is mandatory before trusting any single pair.
Code
from backtest_base import fetch, backtest_signal, metrics

df = fetch("BTCUSDT", "binance", "2023-01-01", "2023-12-31", "1h")
c = df["close"]

def tema(span):
    e1 = c.ewm(span=span, adjust=False).mean()
    e2 = e1.ewm(span=span, adjust=False).mean()
    e3 = e2.ewm(span=span, adjust=False).mean()
    return 3.0 * e1 - 3.0 * e2 + e3

signal = (tema(24) > tema(120)).fillna(False)
res = backtest_signal(df, signal, cost_per_leg=0.0005,
                      funding_per_bar=0.0001 / 8.0)
print(metrics(res, 8760))
Reproduce it
cd blog-drafts/scripts
python backtest_base.py --strategy tema_cross --symbol BTCUSDT --interval 1h \
    --start 2023-01-01 --end 2023-12-31 --fee 0.0005 --funding 0.0000125
Data: Binance public API, hourly OHLCV, 8,735 bars. The tables above reproduce exactly from this command.
This is a backtest on historical data, not investment advice. Past performance does not predict future results.