The Buy-and-Hold Reality: BTC Rose +155% in 2023 and Beat 35 of 36 Strategies
Buy & hold returned +154.94% on BTC/USDT in 2023. After fees and funding, 35 of 36 lab strategies lost to it — and 26 of 36 still beat the drawdown. The case for doing nothing, with the math.
The Buy-and-Hold Reality: BTC Rose +155% in 2023 and Beat 35 of 36 Strategies
The benchmark sat in the data the whole year and nobody mentioned it until now. In 2023, BTC/USDT went from about $16,600 to about $42,300 — +154.94% total return on an hourly basis, with a maximum drawdown of -21.74% and a Sharpe of 2.42. Then the lab ran 36 strategies against it, and the embarrassing part is not what the strategies did to each other. Strategy Lab #42.
The head-to-head
The chart below shows every one of the 36 strategies after fees and funding. The red line is buy & hold.
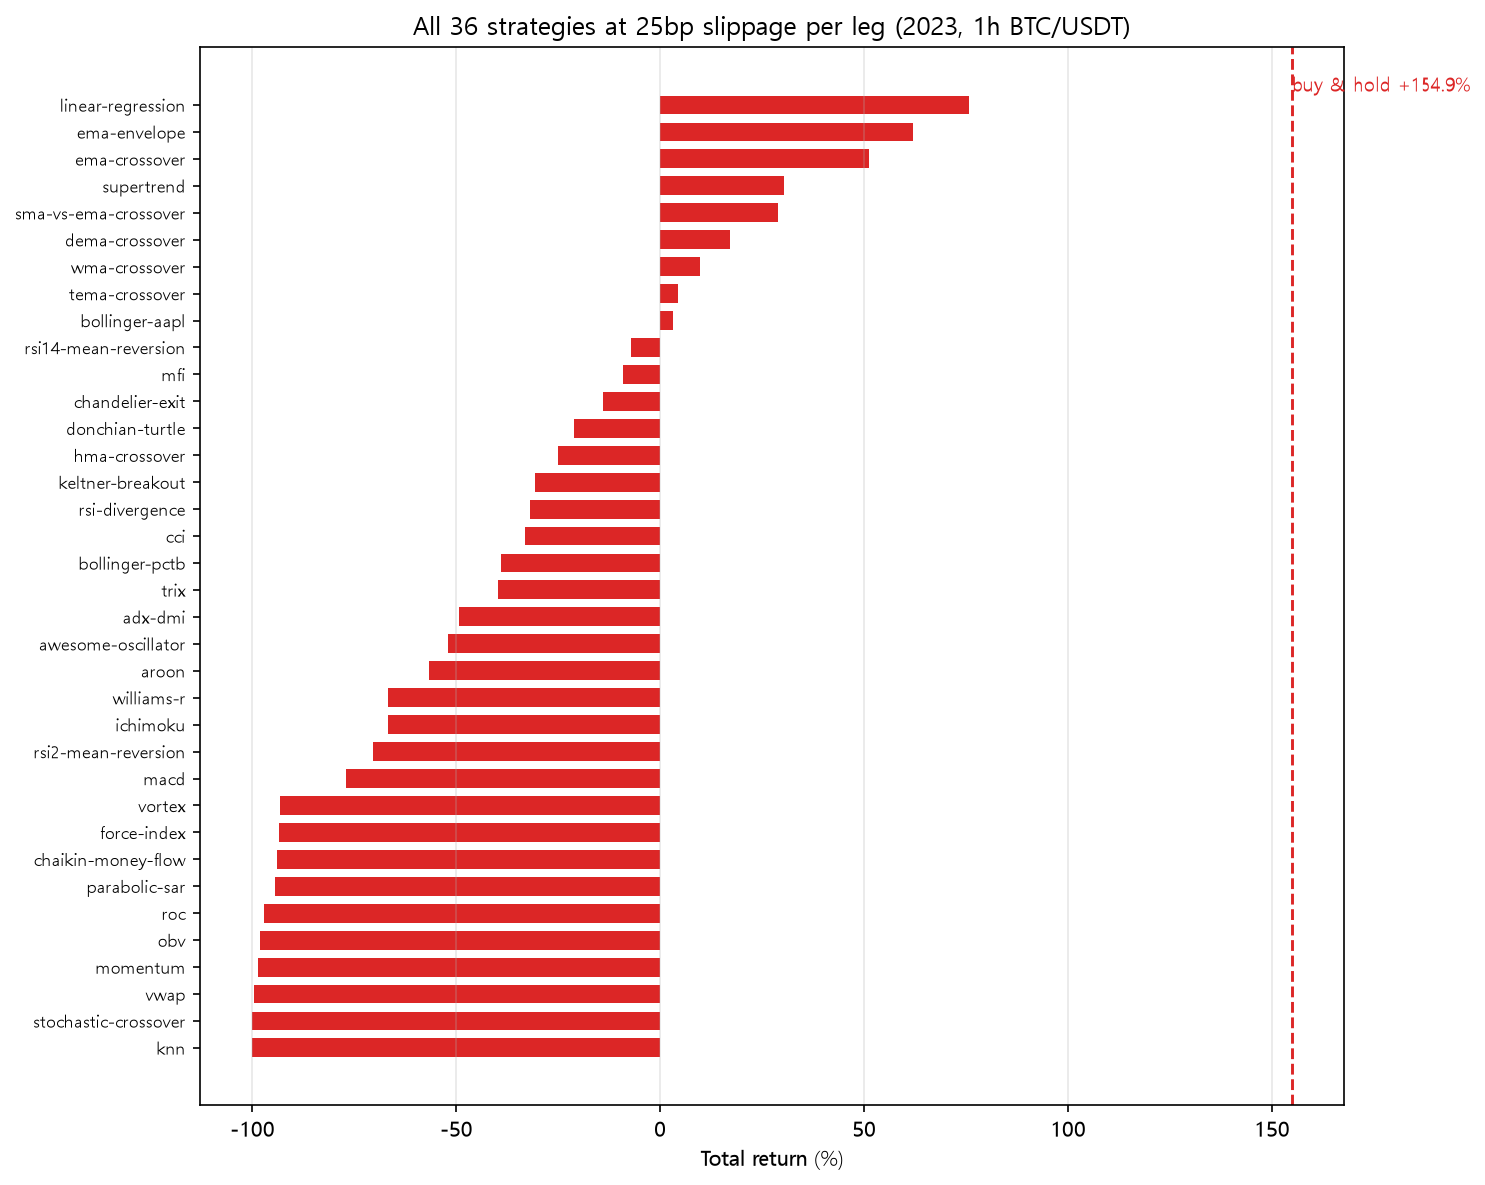
After fees and funding, 35 of 36 strategies lost to doing nothing. The single exception: the linear regression channel (post 17), which returned +199.09% net on AAPL daily data with 106 trades — the only strategy in the lab that beat the passive benchmark, and the only one that also beats it at 25bp (+75.88%... which itself still underperforms holding's +154.94%).
So the trend strategies "worked" — in the weirdest possible way
This is the uncomfortable nuance that the per-post commentary danced around. EMA crossover made +89.38% net. That's a great absolute number. It is also 65 points below holding. The trend rules were long for most of the year; they captured the trend and then handed back the re-entry friction and the whipsaw losses that a continuous position never pays.
Only 8 of 36 strategies beat buy & hold on drawdown. The trend winners did not even do that: EMA crossover's worst drawdown was -22.6%, slightly worse than holding's -21.7%. The drawdown winners are the slow reversion and smooth-trend rules — Aroon (-15.8%), %B (-13.3%), RSI(14) (-16.1%), CCI (-18.5%), TRIX (-18.4%), EMA envelope (-17.0%), DEMA (-20.0%), RSI divergence (-15.9%). The honest framing: these strategies traded return for marginally lower drawdown, and almost all of them overpaid.
The three tiers
| Tier | What it means | Count | Best example |
|---|---|---|---|
| Beat buy & hold (net) | Return > +154.94% | 1 of 36 | linear regression +199.09% |
| Positive but below benchmark | Real net return, still lost to holding | 25 of 36 | EMA +89.38%, TEMA +83.49% |
| Negative after costs | Lost money while BTC doubled | 10 of 36 | Stochastic -71.31%, k-NN -78.53% |
The middle tier is where almost the whole lab lives. And it is the honest place to be: on a +155% trend year, "positive and below the benchmark" is the normal outcome of any sane long-biased system. What the 10-strategy bottom tier shows is that even sanity is optional.
The uncomfortable conclusion
A real 2023 strategy comparison is not "which indicator is best?" It is "why trade at all?" Every rule in this lab was competing against the free position that a coin flipped to heads on January 1 would have held all year. Only one beat it. The lab's actual deliverable, in my opinion, is not the winning indicators — it's this chart: the cost of trying to be clever is visible as the distance between the tops of the bars and the red line.
Code
import pandas as pd
from backtest_base import backtest_signal, metrics

df = pd.read_pickle("assets/data/binance_BTCUSDT_1h_2023-01-01_2023-12-31.pkl")
rets = df["close"].pct_change().fillna(0.0)
hold = (1 + rets).cumprod().iloc[-1] - 1
print(f"buy & hold 2023: {hold:+.2%}  "
      f"maxDD {(df['close'] / df['close'].cummax() - 1).min():+.2%}")
Reproduce it
cd blog-drafts/scripts
python gen_special_assets.py   # regenerates this chart + all group tables
Data: Binance public API, hourly OHLCV, 8,735 bars. Buy & hold figure also sits in every post.json under buy_hold.
This is a backtest on historical data, not investment advice. Past performance does not predict future results.