Price Volume Trend Backtest on BTC/USDT: the Volume Family's Fifth Consecutive Failure
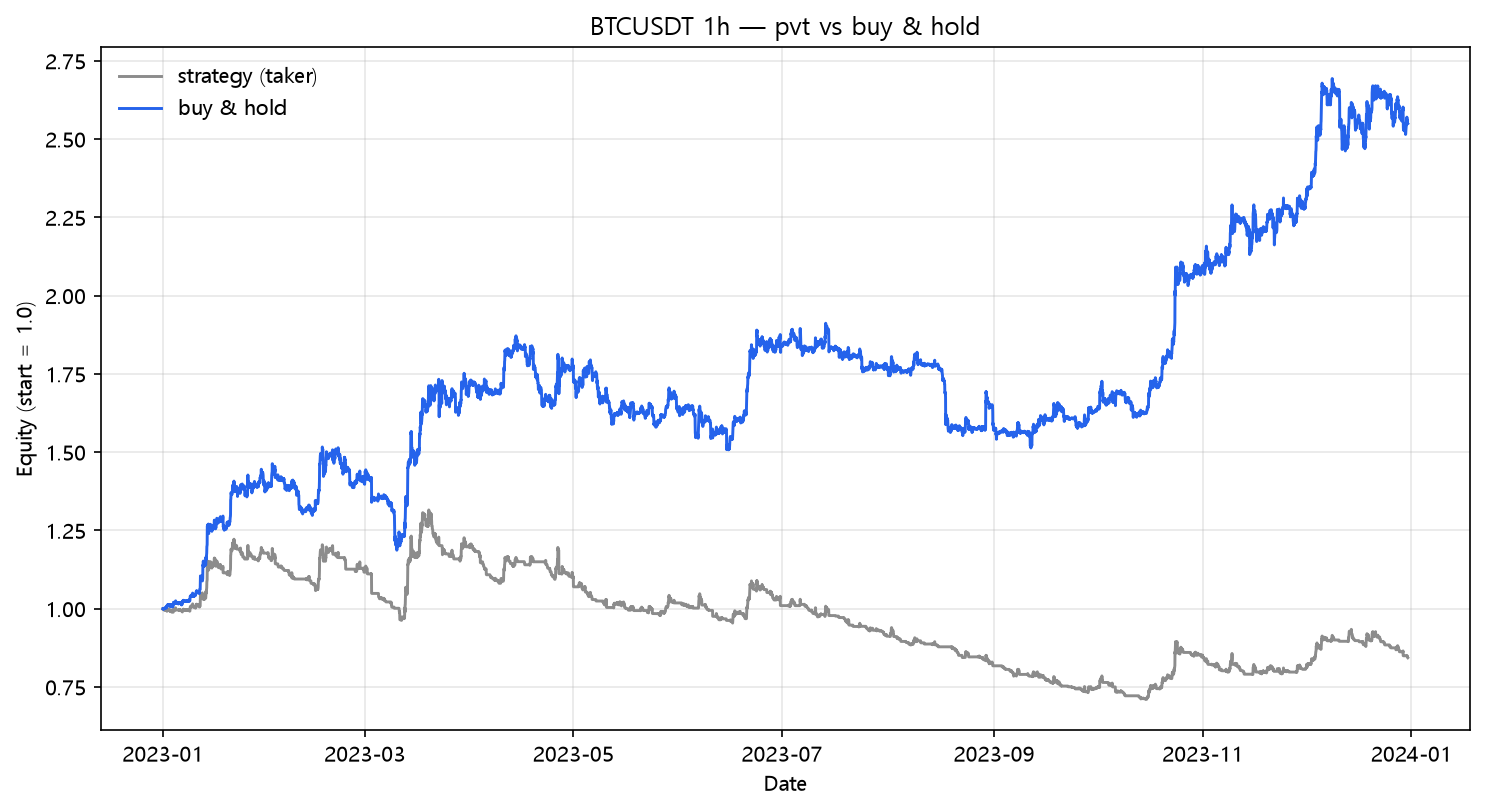
PVT on real hourly BTC/USDT 2023: +31.73% naive, -15.66% after fees and funding, -88.57% at 25bp across 399 trades. The volume trend family is now 0-for-5 — OBV, Force Index, CMF, A/D, and PVT all fail identically.
Price Volume Trend Backtest on BTC/USDT (2023, hourly, real fees)
The Price Volume Trend is OBV's smarter sibling: instead of adding the full bar's volume to the running total, it adds volume scaled by the percentage price move, so a 1% day contributes 1% of its volume and a 10% day contributes 10× more. More information, more sensitivity — and, on hourly crypto, more trades. It failed exactly like the other four volume rules. The volume family is now 0-for-5. Strategy Lab #59.
The setup
PVT = cumulative sum of (close pct-change × volume). Long when PVT is above its 20-bar EMA. Same engine, same costs.
Results
| Strategy | Category | Total return | CAGR | MaxDD | Sharpe | Trades |
|---|---|---|---|---|---|---|
| pvt | volume | -15.66% | -15.66% | -45.99% | -0.37 | 399 |
The fee bill
| Scenario | Cost/leg | Total return | MaxDD | Sharpe | Trades | |---|---:|---:|---:|---:|---:|---:| | naive (zero cost) | 0.00% | +31.73% | -29.55% | 1.02 | 399 | | taker fee 0.05%/leg | 0.05% | -11.62% | -44.67% | -0.23 | 399 | | + funding 0.01%/8h | 0.05% | -15.66% | -45.99% | -0.37 | 399 | | + slippage 10bp/leg | 0.15% | -62.06% | -67.86% | -2.85 | 399 | | + slippage 25bp/leg | 0.30% | -88.57% | -89.37% | -6.42 | 399 |
The pct-scaled PVT traded 399 times — fewer than OBV's 734, but the lab has now measured the whole spectrum and it doesn't matter whether the volume rule is primitive (OBV), range-weighted (A/D), sign-flipping (CMF/Force), or percentage-scaled (PVT): a volume accumulation line above its moving average flips its sign on hourly bars too often to survive costs. PVT's +31.73% gross — the smallest of the five — turned into -15.66% net and a drawdown twice as deep as holding's.
The volume family verdict, finalized
| Strategy | Post | Trades | Naive | Fees+funding | 25bp |
|---|---|---|---|---|---|
| MFI reversion | 29 | 36 | +18.87% | +9.01% | -8.98% |
| Force Index | 33 | 507 | +43.34% | -17.50% | -93.47% |
| CMF | 36 | 557 | +84.53% | -0.00% | -93.84% |
| PVT (this) | — | 399 | +31.73% | -15.66% | -88.57% |
| A/D Line | 51 | 694 | +59.88% | -24.35% | -97.65% |
| OBV | 16 | 734 | +63.78% | -24.95% | -98.10% |
Five trend-following volume rules, five failures, every net result between -0.00% and -24.95%. The family conclusion from post 36 is now closed: on hourly crypto, volume-weighted trend signals have no net edge after costs. The single exception in the family remains the one that barely trades (MFI reversion, 36 trades, +9.01%).
What this does NOT prove
- PVT's divergence use (price new high, PVT not) is a different and legitimate application, untested here.
- On daily bars, trade count would roughly halve and — following the lab's consistent pattern — likely flip the result. Nothing here proves it for PVT specifically.
- One pair, one year, one regime.
Code
from backtest_base import fetch, backtest_signal, metrics
from strategy import sig_pvt

df = fetch("BTCUSDT", "binance", "2023-01-01", "2023-12-31", "1h")
signal = sig_pvt(df, span=20)

res = backtest_signal(df, signal, cost_per_leg=0.0005, funding_per_bar=0.0000125)
print(metrics(res, 8760))
Reproduce it
cd blog-drafts/scripts
python gen_post_assets.py --ids 59
Data: Binance public API, hourly OHLCV, 8,735 bars. Tables above reproduce exactly from this command.
This is a backtest on historical data, not investment advice. Past performance does not predict future results.