PPO Backtest on BTC/USDT: MACD, Renormalized — the Identical Failure
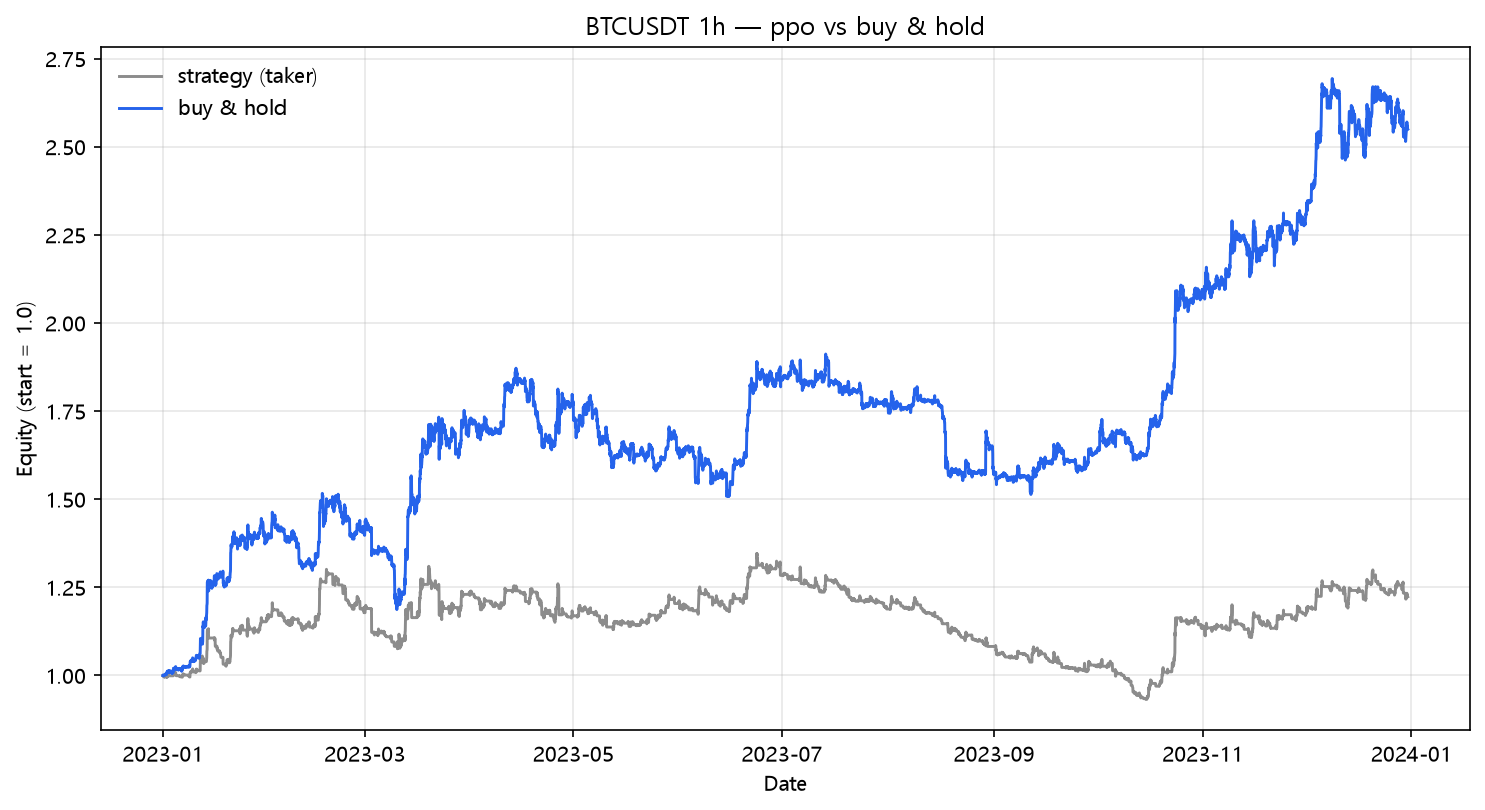
Percentage Price Oscillator (PPO 12/26/9) on real hourly BTC/USDT 2023: +22.32% net, -76.87% at 25bp, 333 trades. It's MACD with one extra division, and it produced MACD's numbers almost exactly.
PPO Backtest on BTC/USDT (2023, hourly, real fees)
The Percentage Price Oscillator is MACD with one extra step: instead of subtracting the slow EMA from the fast one, you subtract and then divide by the slow EMA. It's supposed to be comparable across instruments with different price levels. On the same instrument, with the same parameters, it is literally MACD wearing a different shirt. The backtest agrees — the numbers are nearly identical, right down to the trade count. Strategy Lab #45.
The setup
PPO = (EMA(12) − EMA(26)) / EMA(26) × 100. Long when PPO > its 9-period signal EMA. Signal at bar close, exposed next bar, same cost model as every post in this series. Post 15 ran the identical rule without the denominator.
Results
| Strategy | Category | Total return | CAGR | MaxDD | Sharpe | Trades |
|---|---|---|---|---|---|---|
| ppo | momentum | +22.32% | +22.32% | -30.74% | 0.81 | 333 |
The MACD twin
| Metric | MACD (post 15) | PPO (this) |
|---|---|---|
| Naive return | +79.08% | +79.20% |
| Fees + funding | +22.21% | +22.32% |
| At 25bp/leg | -76.89% | -76.87% |
| Trades | 333 | 333 |
Dividing by the slow EMA is a monotonic-ish rescale; the sign of PPO vs its signal barely differs from the sign of MACD vs its signal. Both strategies produced 333 trades and nearly identical equity. The "normalization" that PPO advertises does nothing for a single-instrument test — it only matters when comparing across symbols, which this lab never does.
The fee bill
| Scenario | Cost/leg | Total return | MaxDD | Sharpe | Trades | |---|---:|---:|---:|---:|---:|---:| | naive (zero cost) | 0.00% | +79.20% | -20.77% | 2.04 | 333 | | taker fee 0.05%/leg | 0.05% | +28.50% | -29.62% | 0.97 | 333 | | + funding 0.01%/8h | 0.05% | +22.32% | -30.74% | 0.81 | 333 | | + slippage 10bp/leg | 0.15% | -37.13% | -54.39% | -1.34 | 333 | | + slippage 25bp/leg | 0.30% | -76.87% | -78.30% | -4.45 | 333 |
666 legs at 0.30% is about 200% of the account per year — at 25bp the strategy has to make two accounts of return before it breaks even. The pattern is the momentum-family pattern from post 40: a real gross edge (+79.20%), a 333-trade churn that halves it, and slippage that finishes the job. PPO is the sixth momentum rule in this lab to end in the exact same shape.
The family verdict so far
Momentum rules now number nine (MACD, TRIX, Awesome, ROC, momentum, OBV, Force Index, CMF, PPO). The score: TRIX +64.74%, Awesome +41.14%, MACD +22.21%, PPO +22.32%, and then six losers including every volume-weighted one. Normalizing an indicator doesn't change its trading frequency, and trading frequency is what decides survival. PPO is the perfect control group: change the formula, keep the trades, keep the result.
What this does NOT prove
- On a different price scale, or comparing two symbols, PPO's normalization has a purpose. This test says nothing against that use case.
- The near-identity with MACD is a property of the 12/26/9 parameters and long-only framing; with different signal logic (zero-line cross, histogram) the two can diverge more.
- One year, one pair, one regime — the usual lab disclaimer applies twice for a strategy whose main finding is "same as MACD."
Code
from backtest_base import fetch, backtest_signal, metrics

df = fetch("BTCUSDT", "binance", "2023-01-01", "2023-12-31", "1h")
c = df["close"]
f = c.ewm(span=12, adjust=False).mean()
s = c.ewm(span=26, adjust=False).mean()
ppo = (f - s) / s
signal = (ppo > ppo.ewm(span=9, adjust=False).mean()).fillna(False)

res = backtest_signal(df, signal, cost_per_leg=0.0005, funding_per_bar=0.0000125)
print(metrics(res, 8760))
Reproduce it
cd blog-drafts/scripts
python gen_post_assets.py --ids 45
Data: Binance public API, hourly OHLCV, 8,735 bars. Tables above reproduce exactly from this command.
This is a backtest on historical data, not investment advice. Past performance does not predict future results.