The Moving Average Bake-Off: EMA vs SMA vs WMA vs DEMA vs TEMA vs HMA on BTC/USDT
Six moving average crossovers, one engine, one year of real hourly BTC/USDT 2023. TEMA wins gross (+116.28% naive) but EMA wins net (+89.38%). HMA is the only one that goes negative at 25bp. The full bake-off table.
The Moving Average Bake-Off: EMA vs SMA vs WMA vs DEMA vs TEMA vs HMA
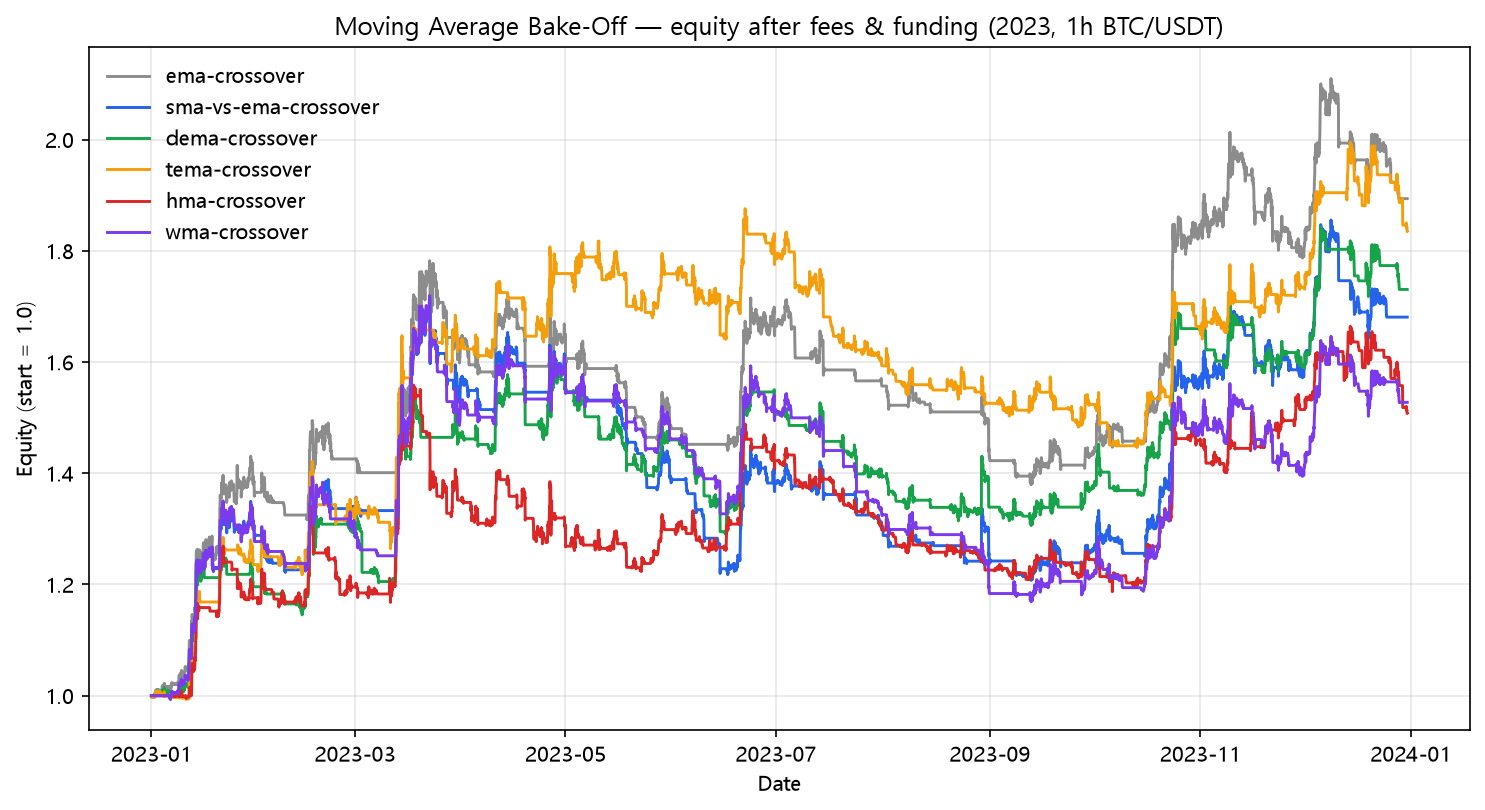
By post 22 the lab had tested six moving average crossovers separately, on the same data, through the same engine. That's six versions of the same bet — "the recent price is above the recent average" — with different smoothing. So instead of a seventh crossover, here is the bake-off: every MA crossover in the lab, side by side, in one table and one equity chart. Strategy Lab #37.
The contestants
- EMA (post 01): exponential smoothing, span 24/120.
- SMA (post 02): arithmetic mean, 24/120.
- WMA (post 22): linear weights, 24/120.
- DEMA (post 19): double-smoothed EMA, 24/120.
- TEMA (post 20): triple-smoothed EMA, 24/120.
- HMA (post 21): Hull MA, lag-reduced WMA, 24/120.
All six are long-only crossovers: fast > slow means in, fast < slow means out, signal taken at bar close, exposed next bar, same cost model.
The results
| # | Strategy | Post | Naive | Fees+funding | 25bp | Trades |
|---|---|---|---|---|---|---|
| 01 | EMA crossover (long when fast > slow) | [ema-crossover](/blog/ema-crossover) | +110.12% | +89.38% | +51.17% | 45 |
| 02 | SMA crossover (long when fast > slow) | [sma-vs-ema-crossover](/blog/sma-vs-ema-crossover) | +87.68% | +68.08% | +28.89% | 53 |
| 19 | DEMA crossover (double-smoothed EMA) | [dema-crossover](/blog/dema-crossover) | +97.17% | +73.05% | +17.09% | 78 |
| 20 | TEMA crossover (triple-smoothed EMA) | [tema-crossover](/blog/tema-crossover) | +116.28% | +83.49% | +4.45% | 113 |
| 21 | Hull MA crossover (lag-reduced WMA) | [hma-crossover](/blog/hma-crossover) | +82.32% | +50.77% | -25.04% | 140 |
| 22 | WMA crossover | [wma-crossover](/blog/wma-crossover) | +72.72% | +52.75% | +9.75% | 66 |
Three things the table says
1. Smoothing didn't buy much. The lag-reduced HMA was the worst net performer (+50.77%) despite the fastest reaction; the plain EMA was the best (+89.38%) while trading the least (45 trades). In a year-long trend, responsiveness is a liability — it whips the position more. TEMA's gross edge (+116.28%) is the biggest of the six, but 113 trades turn it into +4.45% at 25bp slippage, the second-worst cost resilience after HMA's -25.04%.
2. Only HMA loses at 25bp. Five of six MA crossovers stay profitable through a 0.30%/leg cost stack. No other family in this lab can say that. The moving average crossover is the single most cost-robust pattern tested — it just needs slow smoothing to keep trades rare (EMA 45, SMA 53, WMA 66).
3. Every crossover survived a +155% BTC year, and that is not a free lunch. A +89.38% net EMA year vs buy & hold's +154.94% is a loss of 65 points of return for 45 trades of effort. In an environment where holding returned 155% on a single pair, the crossover's real job is risk control — and even that job mostly failed: EMA's worst peak-to-trough was -22.6%, slightly worse than holding's -21.7%. DEMA (-20.0%) and TRIX's -18.4% are the only family entries that genuinely smoothed the ride.
The family verdict
Ranked by net return: EMA > TEMA > SMA > DEMA > WMA > HMA. Ranked by cost resilience (25bp): EMA > SMA > WMA > DEMA > TEMA > HMA. The two rankings agree on the poles: plain EMA, the least sophisticated entry, wins both; HMA, the most sophisticated, loses both. In this lab, sophistication has been a consistent handicap, and the bake-off is the cleanest exhibit yet.
Code
import pandas as pd
from backtest_base import backtest_signal, metrics, plot_equity_curves
from strategy import STRATEGIES

df = pd.read_pickle("assets/data/binance_BTCUSDT_1h_2023-01-01_2023-12-31.pkl")
mas = ["ema_cross", "sma_cross", "wma_cross", "dema_cross", "tema_cross", "hma_cross"]

results = []
for name in mas:
    spec = STRATEGIES[name]
    signal = spec["func"](df, **spec["params"])
    res = backtest_signal(df, signal, cost_per_leg=0.0005, funding_per_bar=0.0000125)
    print(name, metrics(res, 8760)["total_return"])
    results.append((name, res))

plot_equity_curves(results, "ma_bakeoff.png",
                   title="MA crossovers — equity after fees & funding (2023, 1h BTC/USDT)")
Reproduce it
cd blog-drafts/scripts
python gen_special_assets.py   # regenerates this chart + all group tables
Data: Binance public API, hourly OHLCV, 8,735 bars. Every number above reproduces from the manifest + post.json of posts 01, 02, 19, 20, 21, 22.
This is a backtest on historical data, not investment advice. Past performance does not predict future results.