HMA Crossover Backtest on BTC/USDT: The Hull MA and the Weekend I Expected More From It
The Hull Moving Average crossover on real hourly BTC/USDT 2023: +82.32% naive, +50.77% with fees/funding, -25.04% at 25bp across 140 trades. Why 'low lag' marketing doesn't equal 'more profit' on a choppy hourly tape.
HMA Crossover Backtest on BTC/USDT (2023, hourly, real fees)
The Hull moving average is the smoothest-looking line I have ever plotted, and for one weekend I was convinced that was the whole battle. The HMA reduces lag by combining a fast WMA of the price with a slow WMA and then weighting the difference — a trick Alan Hull published in the 2000s that makes the line turn earlier than a plain average. Less lag, earlier turns, therefore more profit. That was the weekend theory. Then the backtest ran, and the line that looked like silk traded 140 times in one year and turned +82.32% of theoretical profit into -25.04% at 25bp of slippage. Strategy Lab #21.
The setup
HMA(24) vs HMA(120), long when the fast Hull sits above the slow Hull. The HMA itself: take WMA over period/2 and WMA over the full period, subtract (twice the fast minus the slow), then take a WMA of that over sqrt(period). It genuinely turns faster than a plain SMA — that's not marketing, the math does what it says. The problem is what "turns faster" means on hourly crypto: it also exits faster, and on a tape full of noise-faked breaks, fast exits are exits you pay for.
Results
| Strategy | Category | Total return | CAGR | MaxDD | Sharpe | Trades |
|---|---|---|---|---|---|---|
| hma_cross | trend | +50.77% | +50.94% | -23.83% | 1.45 | 140 |
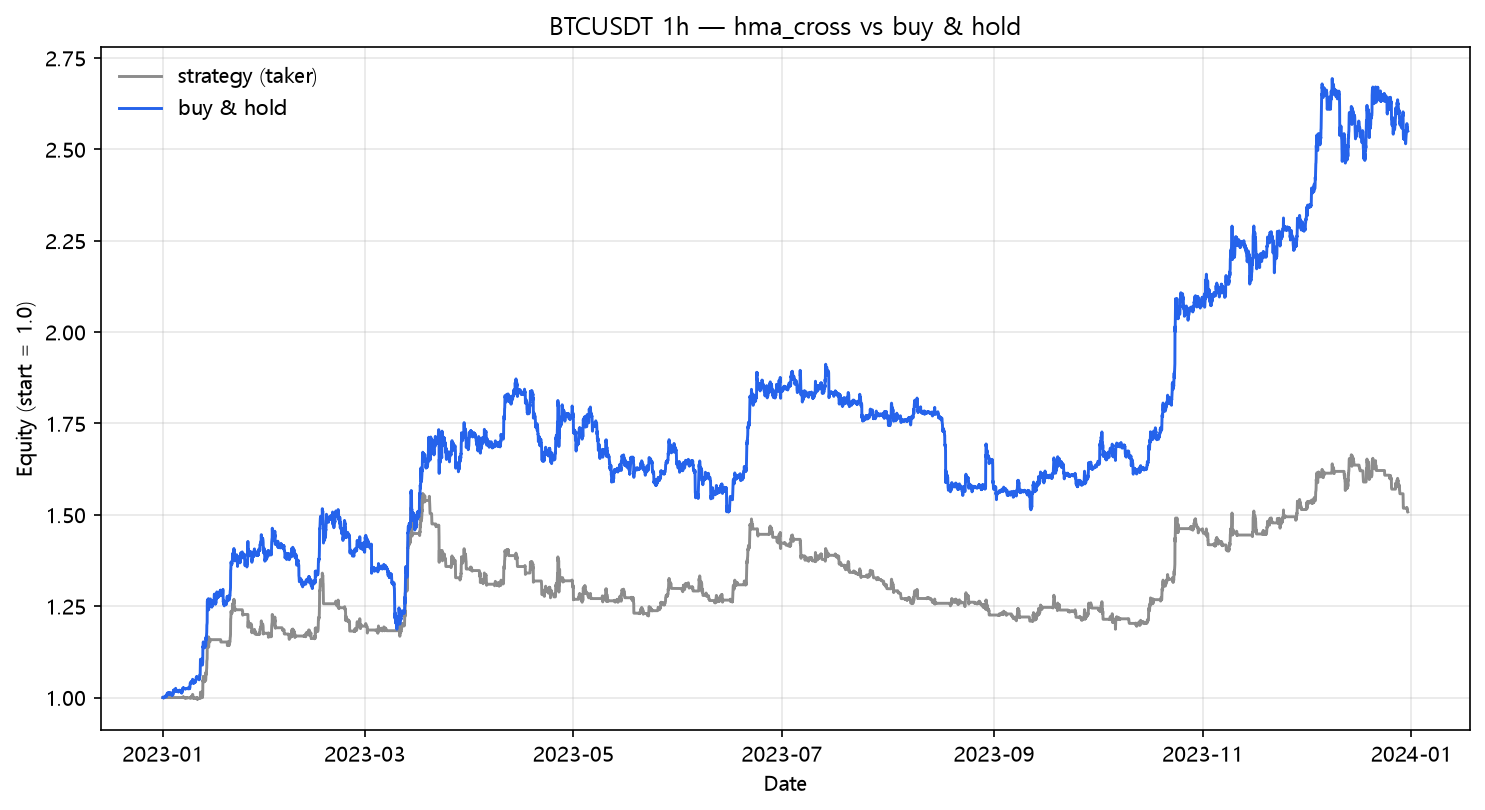
At zero cost the HMA made +82.32% — respectable, but note it's behind both the DEMA's +97.17% (post 19) and the plain EMA's +110.12% (post 01). The "less lag" advantage never showed up as more return, because lag cuts both ways: slower averages hold through noise, faster averages stop out through it.
The fee bill
| Scenario | Cost/leg | Total return | MaxDD | Sharpe | Trades | |---|---:|---:|---:|---:|---:|---:| | naive (zero cost) | 0.00% | +82.32% | -18.52% | 2.05 | 140 | | taker fee 0.05%/leg | 0.05% | +58.58% | -21.60% | 1.61 | 140 | | + funding 0.01%/8h | 0.05% | +50.77% | -23.83% | 1.45 | 140 | | + slippage 10bp/leg | 0.15% | +14.03% | -35.49% | 0.57 | 140 | | + slippage 25bp/leg | 0.30% | -25.04% | -49.91% | -0.73 | 140 |
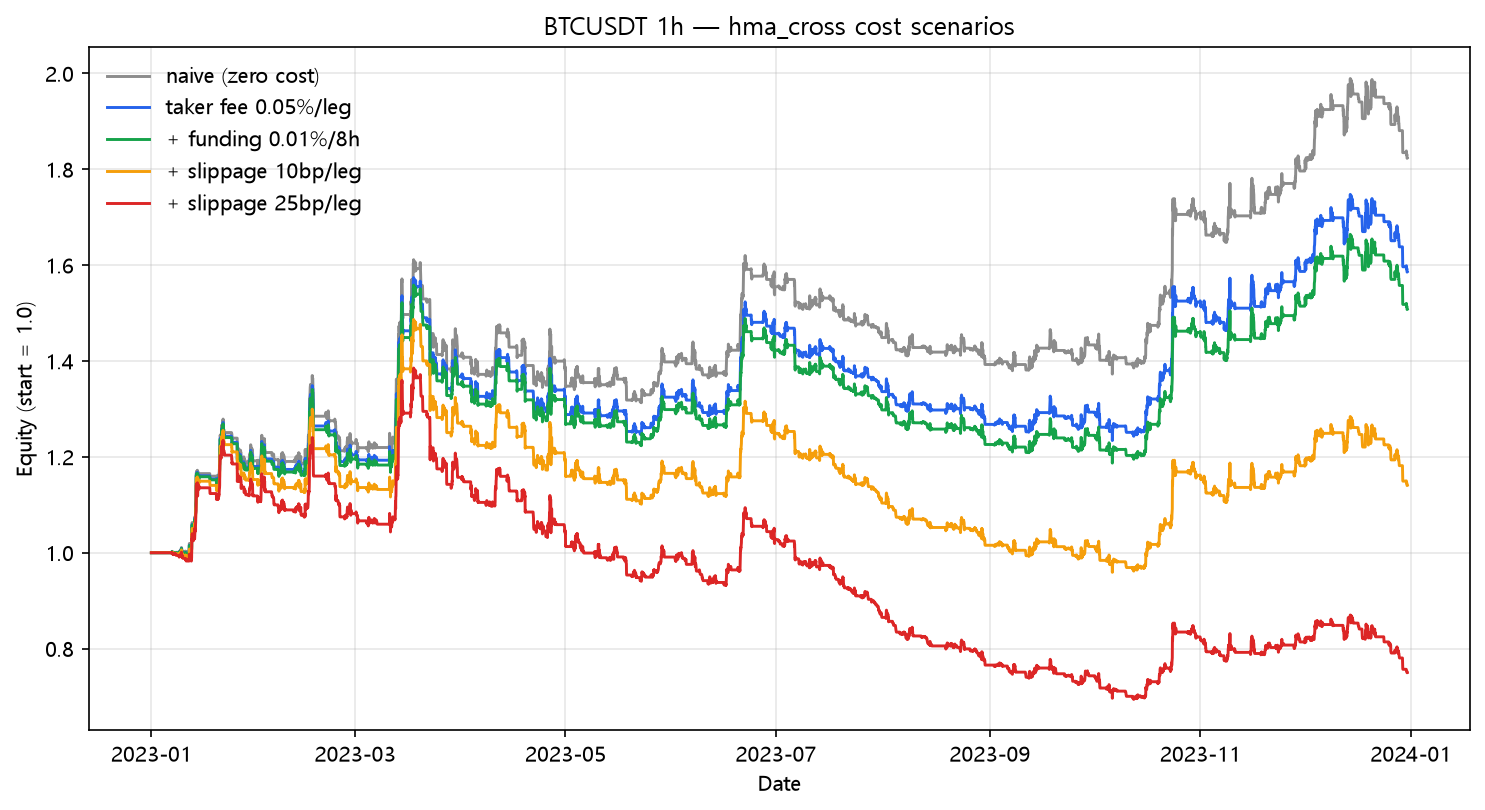
+82.32% → -25.04%. The weekend theory met the fee bill. 140 trades = 279 legs, and at 25bp of slippage the HMA gives back over a hundred points. Win rate was 36.4% (51/140) — trend-follower territory again, but the winners weren't big enough to cover the churn. The honest comparison to the other moving averages of this lab:
| MA variant | Naive | With fees+funding | 25bp | Trades |
|---|---|---|---|---|
| EMA 24/120 (post 01) | +110.12% | +89.38% | +51.17% | 45 |
| WMA 24/120 (post 22) | +72.72% | +52.75% | +9.75% | 66 |
| DEMA 24/120 (post 19) | +97.17% | +73.05% | +17.09% | 78 |
| TEMA 24/120 (post 20) | +116.28% | +83.49% | +4.45% | 113 |
| HMA 24/120 (this) | +82.32% | +50.77% | -25.04% | 140 |
The ranking changes depending on the column. At zero cost, EMA and TEMA lead. Under 25bp, EMA is the champion. The "lowest lag" HMA finishes last at fees+funding — which is the real lesson of the whole moving-average series: lag is not the enemy; frequency is.
What this does NOT prove
- HMA(24/120) is one parameter pair; Hull's own writing suggests shorter HMAs for entry timing rather than full position trading.
- 2023's hourly tape favored slow trend followers. HMA's faster turns could shine in choppier regimes where EMA whipsaws — the mirror image of what we saw here.
- I plotted the line on a weekend and got excited, which is exactly how the fee bill always wins.
Code
from backtest_base import fetch, backtest_signal, metrics

df = fetch("BTCUSDT", "binance", "2023-01-01", "2023-12-31", "1h")
c = df["close"]

def wma(period):
    w = np.arange(1, period + 1)
    return c.rolling(period).apply(
        lambda y: float(np.dot(y, w) / w.sum()), raw=True)

def hma(period):
    half = max(int(period / 2), 1)
    sqrtn = max(int(period ** 0.5), 1)
    inner = 2.0 * wma(half) - wma(period)
    return inner.rolling(sqrtn).apply(
        lambda y: float(np.dot(y, np.arange(1, sqrtn + 1)) / (sqrtn * (sqrtn + 1) / 2)), raw=True)

signal = (hma(24) > hma(120)).fillna(False)
res = backtest_signal(df, signal, cost_per_leg=0.0005,
                      funding_per_bar=0.0001 / 8.0)
print(metrics(res, 8760))
Reproduce it
cd blog-drafts/scripts
python backtest_base.py --strategy hma_cross --symbol BTCUSDT --interval 1h \
    --start 2023-01-01 --end 2023-12-31 --fee 0.0005 --funding 0.0000125
Data: Binance public API, hourly OHLCV, 8,735 bars. The tables above reproduce exactly from this command.
This is a backtest on historical data, not investment advice. Past performance does not predict future results.