Ichimoku TK Cross Backtest on BTC/USDT: +33.26% Net, and a Cloud-Ichid for Post 04
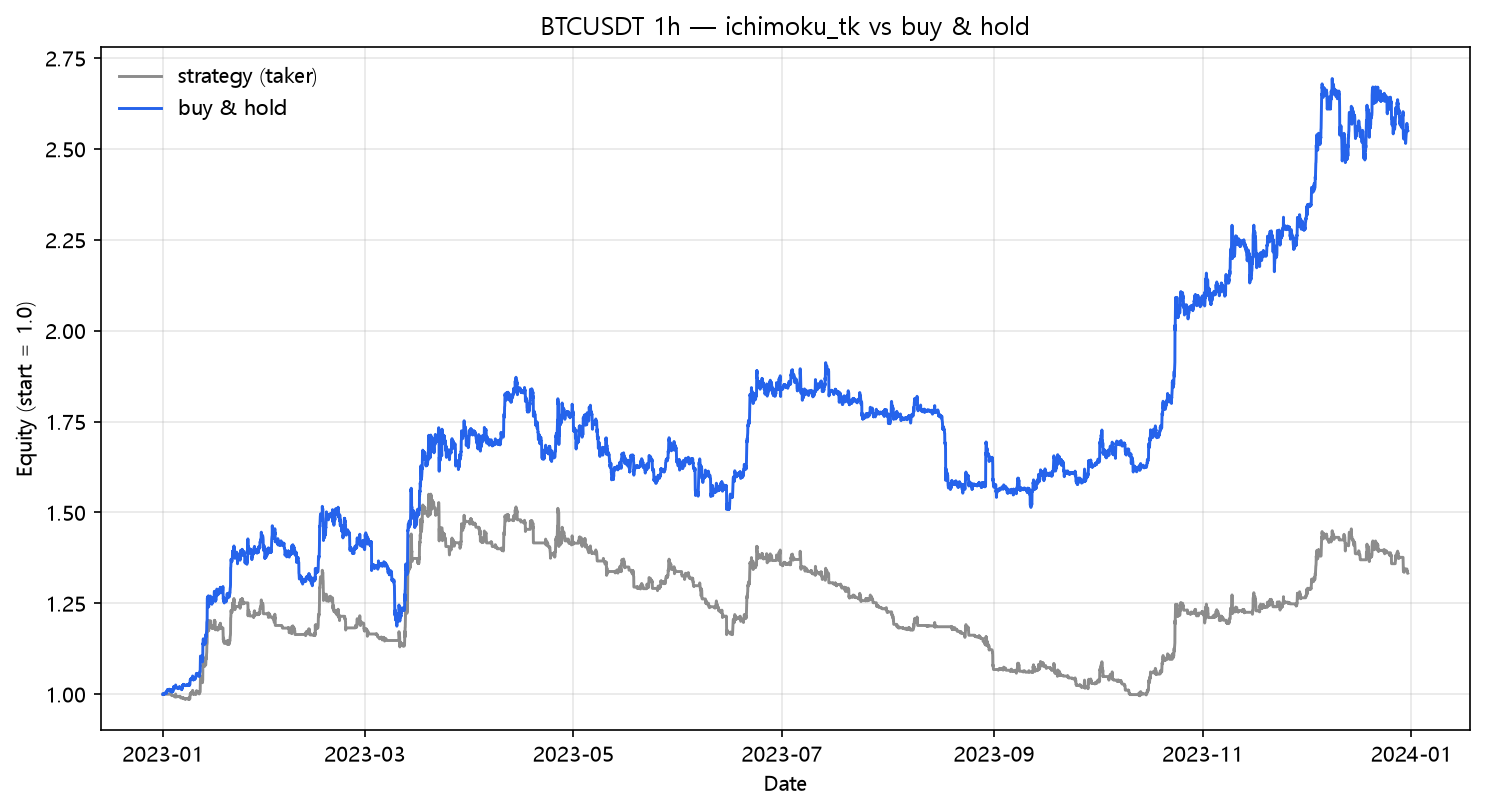
The Tenkan/Kijun (TK) cross on real hourly BTC/USDT 2023: +78.30% naive, +33.26% after fees and funding, 238 trades — more than double the net return of post 04's cloud rule on the same indicator family.
Ichimoku TK Cross Backtest on BTC/USDT (2023, hourly, real fees)
Ichimoku is a whole trading system, and different parts of it produce different strategies. Post 04 tested the famous "price above the cloud" rule and got +16.21% net. This post tests a different part of the same system — the Tenkan/Kijun cross, the Ichimoku analogue of a fast/slow MA crossover. It more than doubled the cloud rule's net return. Same indicator family, different signal, different outcome. Strategy Lab #58.
The setup
Tenkan (conversion) = (9-bar high + 9-bar low) / 2. Kijun (baseline) = (26-bar high + 26-bar low) / 2. Long when Tenkan crosses above Kijun, exit when Tenkan crosses below Kijun. Same engine, same costs.
Results
| Strategy | Category | Total return | CAGR | MaxDD | Sharpe | Trades |
|---|---|---|---|---|---|---|
| ichimoku_tk | trend | +33.26% | +33.26% | -35.80% | 1.03 | 238 |
The fee bill
| Scenario | Cost/leg | Total return | MaxDD | Sharpe | Trades | |---|---:|---:|---:|---:|---:|---:| | naive (zero cost) | 0.00% | +78.30% | -24.16% | 1.90 | 238 | | taker fee 0.05%/leg | 0.05% | +40.60% | -33.89% | 1.19 | 238 | | + funding 0.01%/8h | 0.05% | +33.26% | -35.80% | 1.03 | 238 | | + slippage 10bp/leg | 0.15% | -17.17% | -51.57% | -0.39 | 238 | | + slippage 25bp/leg | 0.30% | -59.44% | -68.40% | -2.48 | 238 |
238 trades is the Ichimoku system's known weakness — the TK cross is a fast signal, and on hourly bars it fires a lot. The net +33.26% survives real fees comfortably, and then 25bp removes it. The trade-off with the cloud rule (250 trades, +16.21%) is stark: the TK cross made double the net return with fewer trades and the same indicator family.
The Ichimoku internal comparison
| Signal | Trades | Naive | Fees+funding | 25bp | |---|---:|---:|---:|---:|---:| | Cloud: price above cloud (post 04) | 250 | +56.01% | +16.21% | -66.78% | | TK cross (this) | 238 | +78.30% | +33.26% | -59.44% |
Both Ichimoku variants underperform a plain EMA crossover (+89.38% net, post 01) on the same data — the layered Ichimoku mechanics buy nothing over a two-line EMA. But within Ichimoku, the TK cross is the better signal, because its entry (Tenkan breaking Kijun) waits for an actual confirmed turn rather than merely holding price above a lagged cloud.
What this does NOT prove
- Full Ichimoku trading includes the Kijun as a trailing stop, the cloud as a filter, and the Chikou span confirmation. The TK cross here is a skeleton of the system.
- The cloud rule's job is regime identification, not timing; as a filter on top of the TK cross it could improve the result — untested here.
- One pair, one year, one regime.
Code
from backtest_base import fetch, backtest_signal, metrics
from strategy import sig_ichimoku_tk

df = fetch("BTCUSDT", "binance", "2023-01-01", "2023-12-31", "1h")
signal = sig_ichimoku_tk(df, tenkan=9, kijun=26)

res = backtest_signal(df, signal, cost_per_leg=0.0005, funding_per_bar=0.0000125)
print(metrics(res, 8760))
Reproduce it
cd blog-drafts/scripts
python gen_post_assets.py --ids 58
Data: Binance public API, hourly OHLCV, 8,735 bars. Tables above reproduce exactly from this command.
This is a backtest on historical data, not investment advice. Past performance does not predict future results.