DEMA Crossover Backtest on BTC/USDT: Double-Smoothing Halves the Whipsaw Bill
The DEMA (double exponential moving average) crossover on real hourly BTC/USDT 2023: +97.17% naive, +73.05% with taker + funding, +17.09% at 25bp slippage across just 78 trades. Why less smoothing noise = fewer wrong exits.
DEMA Crossover Backtest on BTC/USDT (2023, hourly, real fees)
The first thing I noticed when I plotted the DEMA against the close was how rarely it crosses. That's the whole pitch of the double exponential moving average: you smooth an EMA, then smooth the smoothed EMA, and the result is an average that still reacts to real turns but ignores the tiny ones. For a crossover trader, noise is the enemy and DEMA is the noise filter. So I ran it — EMA(24) vs DEMA(120), long when the fast line sits above the slow line — over a full year of hourly BTC/USDT. Strategy Lab #19.
What changed compared to a plain EMA crossover
A plain EMA(24/120) crossover (post 01) ended 2023 at +89.38% after taker fees and funding on just 45 trades. DEMA trades more — 78 round trips — but the entries land at different moments. Double-smoothing means the slow line needs two consecutive rounds of averaging to catch up, so it reacts more slowly to a fade and more firmly to a real break. In a year where BTC chopped for months before trending, that meant fewer round trips through dead zones and holding through more of the actual run.
Results
| Strategy | Category | Total return | CAGR | MaxDD | Sharpe | Trades |
|---|---|---|---|---|---|---|
| dema_cross | trend | +73.05% | +73.32% | -20.03% | 1.88 | 78 |
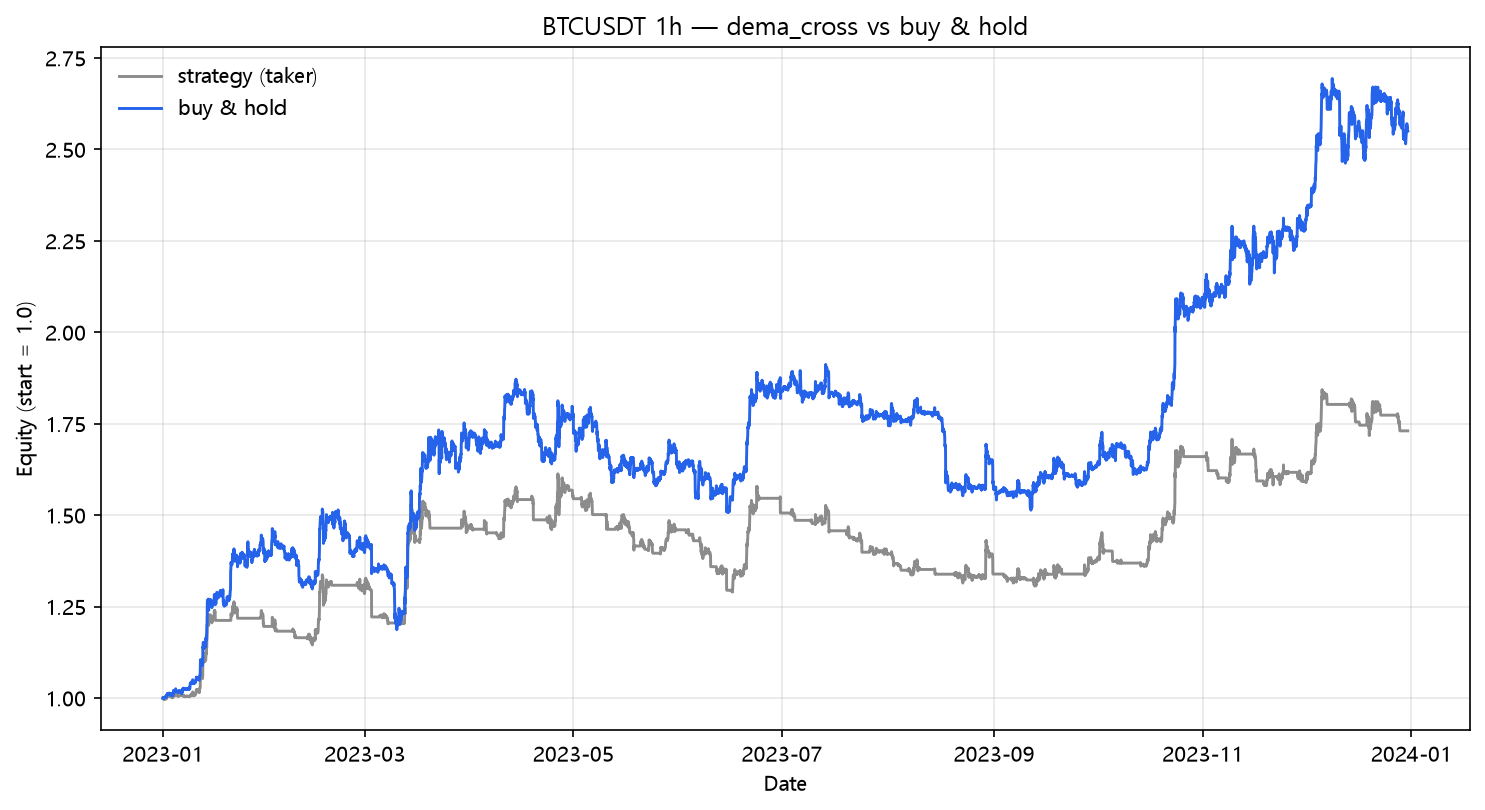
The zero-cost DEMA made +97.17% with a Sharpe of 2.29. Buy & hold made +154.94% over the same year, so the crossover still trails the simplest possible trade — but it does it with a slightly shallower drawdown (-18.23% vs -21.74%). On a year as good as 2023, holding wins on raw return; the crossover's job is to survive the bad years, and one good year can't prove that.
The fee bill
| Scenario | Cost/leg | Total return | MaxDD | Sharpe | Trades |
|---|---|---|---|---|---|
| naive (zero cost) | 0.00% | +97.17% | -18.23% | 2.29 | 78 |
| taker fee 0.05%/leg | 0.05% | +82.37% | -19.37% | 2.04 | 78 |
| + funding 0.01%/8h | 0.05% | +73.05% | -20.03% | 1.88 | 78 |
| + slippage 10bp/leg | 0.15% | +48.03% | -24.22% | 1.39 | 78 |
| + slippage 25bp/leg | 0.30% | +17.09% | -31.38% | 0.65 | 78 |
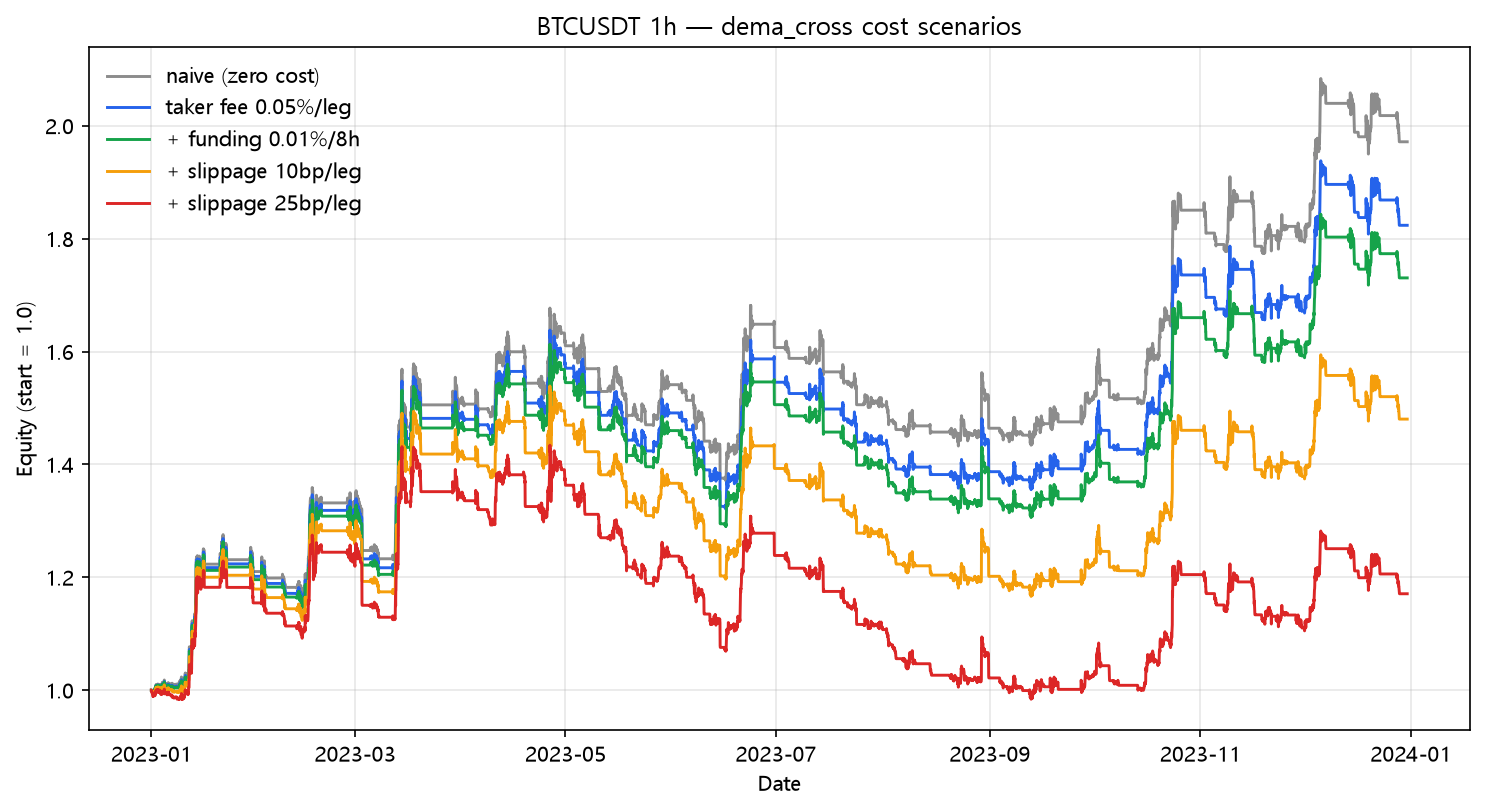
+97.17% → +17.09%. The strategy stays positive in every cost scenario — 78 trades over 156 legs costs about 9.75% of the account per year at taker-plus-slippage, and the trend still out-earns the bill. Only 23 of the 78 round trips were winners (29.5% win rate), which is normal for a trend follower: the edge comes from a handful of large winners, not from batting average. Compare that to k-NN's 1,821 trades (post 18) and you see the difference frequency makes. The indicator that trades rarely is worth more than the model that trades constantly.
What this does NOT prove
- One year, one market, one parameter set (24/120). The 2023 BTC tape rewarded patience; a choppy year would punish a slow trend follower differently.
- Win rate of 29.5% means most trades lose. A 25bp slip on a mean-reversion setup would have crushed this — trend following survives slippage precisely because it trades so rarely.
- DEMA is not "better than EMA" in general; it's a different response profile. On daily data or on equities the ranking could flip entirely.
Code
from backtest_base import fetch, backtest_signal, metrics

df = fetch("BTCUSDT", "binance", "2023-01-01", "2023-12-31", "1h")
c = df["close"]
e1 = c.ewm(span=24, adjust=False).mean()          # 1차 EMA
e2 = e1.ewm(span=24, adjust=False).mean()          # 2차 EMA
dema_fast = 2.0 * e1 - e2
e1s = c.ewm(span=120, adjust=False).mean()         # 슬로우 DEMA
e2s = e1s.ewm(span=120, adjust=False).mean()
dema_slow = 2.0 * e1s - e2s

signal = (dema_fast > dema_slow).fillna(False)
res = backtest_signal(df, signal, cost_per_leg=0.0005,
                      funding_per_bar=0.0001 / 8.0)
print(metrics(res, 8760))
Reproduce it
cd blog-drafts/scripts
python backtest_base.py --strategy dema_cross --symbol BTCUSDT --interval 1h \
    --start 2023-01-01 --end 2023-12-31 --fee 0.0005 --funding 0.0000125
Data: Binance public API, hourly OHLCV, 8,735 bars. The tables above reproduce exactly from this command.
This is a backtest on historical data, not investment advice. Past performance does not predict future results.