Chande Momentum Oscillator Backtest on BTC/USDT: +98.99% Gross, +3.30% Net, Gone
CMO(14) on real hourly BTC/USDT 2023: the gross edge is +98.99%, fees and funding cut it to -1.55%, 25bp makes it -96.31%. 656 trades and the best-looking gross curve in the momentum family.
Chande Momentum Oscillator Backtest on BTC/USDT (2023, hourly, real fees)
The Chande Momentum Oscillator is RSI's raw-material cousin: instead of smoothing up-moves and down-moves with an EMA, it sums them over N bars and takes the ratio. The result on 2023 BTC is the most dramatic gross-to-net collapse in the momentum family — and that's saying something. Strategy Lab #47.
The setup
CMO = 100 × (sum of up-moves − sum of down-moves) / (sum of up-moves + sum of down-moves) over 14 bars. Long when CMO > 0. Same engine, same costs.
Results
| Strategy | Category | Total return | CAGR | MaxDD | Sharpe | Trades |
|---|---|---|---|---|---|---|
| cmo | momentum | -1.55% | -1.55% | -39.59% | 0.12 | 656 |
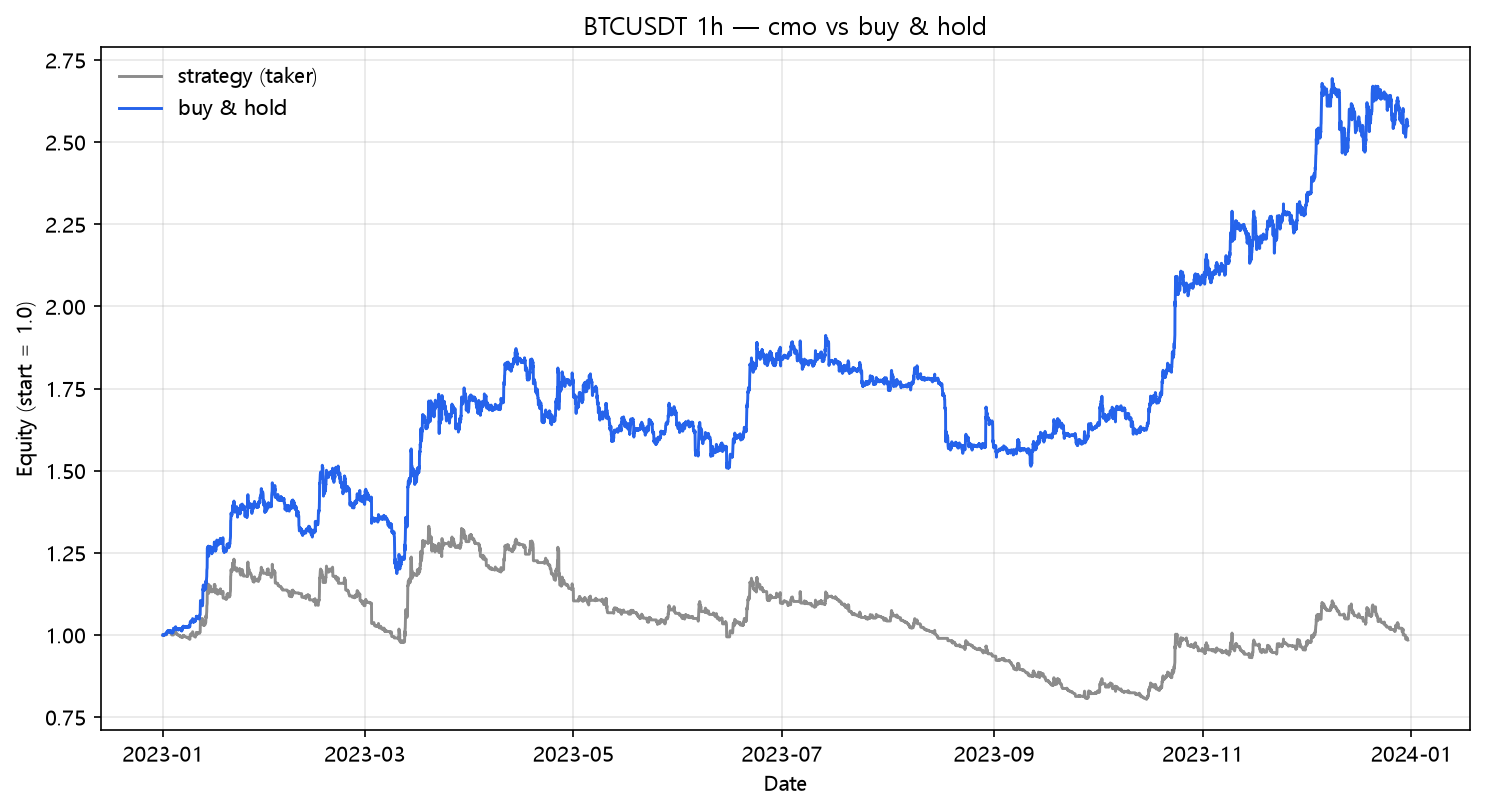
The gross number that fooled nobody
Naive CMO returned +98.99% with a -16.4% drawdown and Sharpe 2.28 — on paper, one of the best gross curves in the entire lab, second in the momentum family only to TRIX. Then the engine applied a 0.05% taker fee per leg: +3.30%. Add hourly funding: -1.55%. Add 25bp of slippage: -96.31%.
The reason is 656 trades: 1,312 legs, each paying a fee, each paying a spread you'll never see quoted. The gross edge in 2023 was real — every momentum rule found it — but CMO's edge was the thinnest per trade of any rule that tried to harvest it, and the noise-to-signal was so high that the strategy was flat-to-negative before a single fee was paid.
The fee bill
| Scenario | Cost/leg | Total return | MaxDD | Sharpe | Trades | |---|---:|---:|---:|---:|---:|---:| | naive (zero cost) | 0.00% | +98.99% | -16.42% | 2.28 | 656 | | taker fee 0.05%/leg | 0.05% | +3.30% | -37.97% | 0.26 | 656 | | + funding 0.01%/8h | 0.05% | -1.55% | -39.59% | 0.12 | 656 | | + slippage 10bp/leg | 0.15% | -73.50% | -76.75% | -3.87 | 656 | | + slippage 25bp/leg | 0.30% | -96.31% | -96.36% | -9.50 | 656 |
+98.99% → -96.31%. Every 0.05% of cost per leg is worth roughly 65 points of annual return to a 656-trade strategy. CMO sits in the same cost coffin as ROC (post 31), Momentum (post 35), and Elder Ray (post 50): sign-flipping momentum rules that were engineered to be insensitive to price but are maximally sensitive to trade count.
The momentum scoreboard, updated
| Strategy | Trades | Naive | Fees+funding | 25bp |
|---|---|---|---|---|
| TRIX (post 32) | 201 | +111.94% | +64.74% | -39.65% |
| Awesome (post 34) | 216 | +84.99% | +41.14% | -52.04% |
| PPO (post 45) | 333 | +79.20% | +22.32% | -76.87% |
| MACD (post 15) | 333 | +79.08% | +22.21% | -76.89% |
| CMO (this) | 656 | +98.99% | -1.55% | -96.31% |
| ROC (post 31) | 700 | +97.20% | -6.61% | -97.19% |
| Momentum (post 35) | 785 | +74.31% | -24.00% | -98.51% |
The ranking is, once again, a ranking by trade count wearing the costume of a ranking by indicator. CMO is the family's clearest proof that the gross edge is not the product.
What this does NOT prove
- A CMO with a zero-line filter plus an ADX-style regime gate (trade only when CMO is strongly positive) is the standard professional tweak and is not tested here.
- Period 14 is the default; longer periods trade less and follow the family pattern.
- One year, one pair, one regime — but note that regime cuts both ways: a ranging year would make CMO's reversion behavior better while keeping its fee problem.
Code
from backtest_base import fetch, backtest_signal, metrics
from strategy import sig_cmo

df = fetch("BTCUSDT", "binance", "2023-01-01", "2023-12-31", "1h")
signal = sig_cmo(df, period=14)

res = backtest_signal(df, signal, cost_per_leg=0.0005, funding_per_bar=0.0000125)
print(metrics(res, 8760))
Reproduce it
cd blog-drafts/scripts
python gen_post_assets.py --ids 47
Data: Binance public API, hourly OHLCV, 8,735 bars. Tables above reproduce exactly from this command.
This is a backtest on historical data, not investment advice. Past performance does not predict future results.