Trend Family Face-Off: SuperTrend vs Ichimoku vs ADX vs EMA Envelope vs the Rest
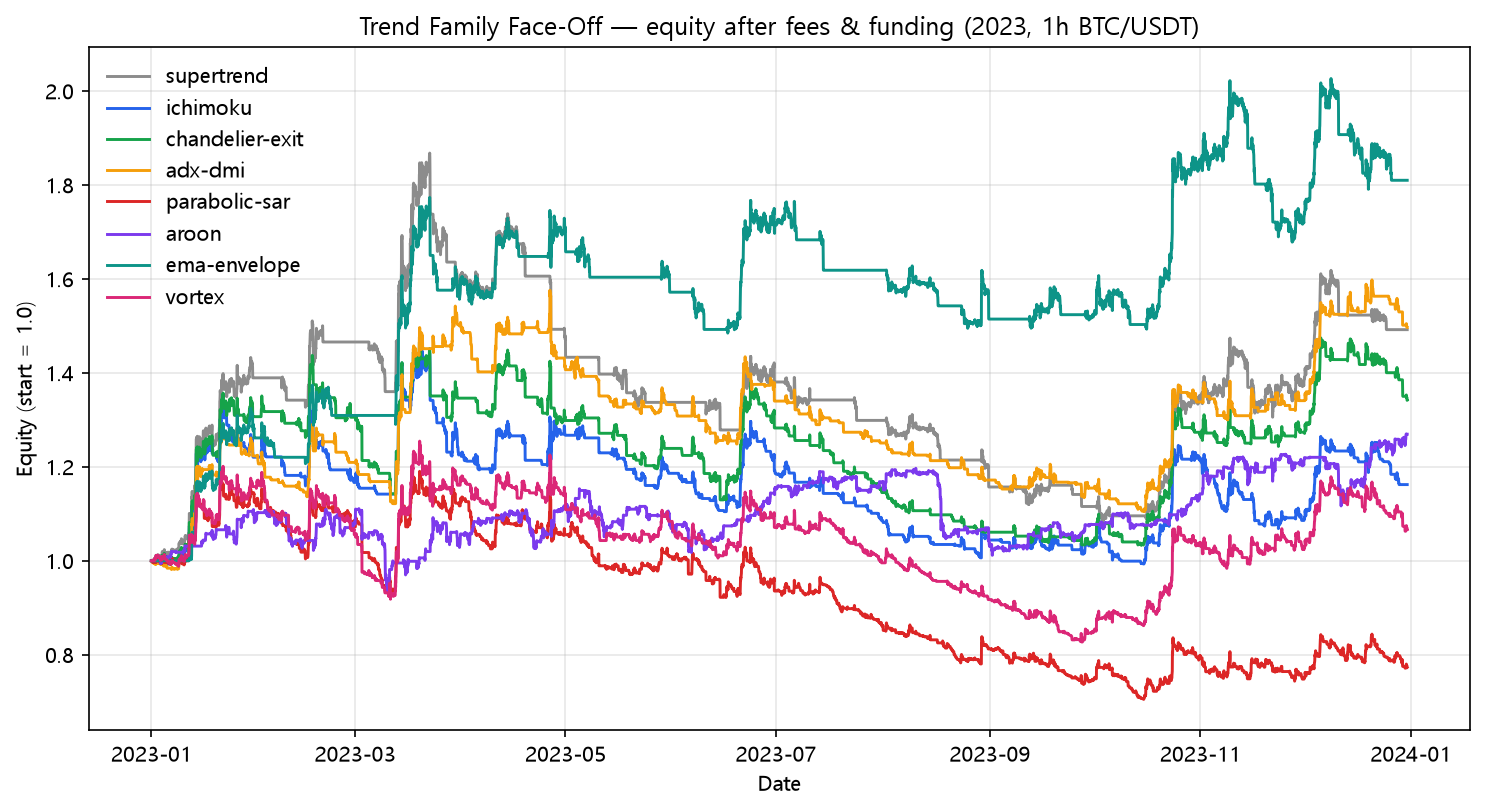
Eight trend followers on the same hourly BTC/USDT 2023. EMA envelope wins with +80.99% net and is the only one that keeps +62.11% at 25bp. Vortex (+6.59%) and Parabolic SAR (-22.70%) are the family's worst. Head-to-head table.
Trend Family Face-Off: SuperTrend vs Ichimoku vs ADX vs EMA Envelope vs the Rest
The lab's biggest family deserves a bracket. Eight trend-following rules — everything that says "go long when the trend says up, stay out when it doesn't" — run on identical data, identical engine, identical costs. The face-off. Strategy Lab #39.
The bracket
- SuperTrend (post 03): ATR bands, flip on close crossing — 27 trades.
- Ichimoku (post 04): price above the cloud — 250 trades.
- Chandelier Exit (post 05): Donchian entry + ATR trail — 89 trades.
- ADX/DMI (post 06): +DI > -DI with ADX gate — 216 trades.
- Parabolic SAR (post 07): long above the SAR — 525 trades.
- Aroon (post 23): bars since extremes — 214 trades.
- EMA envelope (post 24): break above the band, ride to the center — 22 trades.
- Vortex (post 25): VI+ > VI- — 549 trades.
The results
| # | Strategy | Post | Naive | Fees+funding | 25bp | Trades |
|---|---|---|---|---|---|---|
| 03 | SuperTrend (ATR bands, flip on close crossing) | [supertrend](/blog/supertrend) | +62.50% | +49.19% | +30.32% | 27 |
| 04 | Ichimoku cloud (long above cloud) | [ichimoku](/blog/ichimoku) | +56.01% | +16.21% | -66.78% | 250 |
| 05 | Chandelier Exit (Donchian entry + ATR trail) | [chandelier-exit](/blog/chandelier-exit) | +53.90% | +34.17% | -13.87% | 89 |
| 06 | ADX/DMI filter (+DI > -DI and ADX above threshold) | [adx-dmi](/blog/adx-dmi) | +92.23% | +49.66% | -49.27% | 216 |
| 07 | Parabolic SAR (long above SAR) | [parabolic-sar](/blog/parabolic-sar) | +36.74% | -22.70% | -94.43% | 525 |
| 23 | Aroon Up/Down (bars since extremes) | [aroon](/blog/aroon) | +65.23% | +26.93% | -56.54% | 214 |
| 24 | EMA envelope trend (break above band) | [ema-envelope](/blog/ema-envelope) | +96.69% | +80.99% | +62.11% | 22 |
| 25 | Vortex (VI+ > VI-) | [vortex](/blog/vortex) | +93.92% | +6.59% | -93.17% | 549 |
The knockout round
Winner: EMA envelope (post 24), and it isn't close. +80.99% net with just 22 trades — the second-lowest trade count of the whole family, second only to SuperTrend's 27. Its gross edge (+96.69%) survives costs almost intact, and at 25bp it still returns +62.11%, the best cost-resilience figure in the entire lab. The entry rule ("close closes above the 50-bar EMA + 2% band") is deliberately rare; the exit (close back below the EMA) is mean-reverting. Slow in, fast out, 22 times. That structure — not any indicator — is why it wins.
Runner-up: SuperTrend (post 03). +49.19% net, and the only other trend rule that stays strongly positive at 25bp (+30.32%). Its 27 trades ride the year-long trend with almost no whipsaw.
The heavyweight underperformers: Vortex (+6.59%) and Parabolic SAR (-22.70%). Both look great gross (Vortex +93.92% naive!) and both trade constantly — 549 and 525 times. Vortex returned essentially nothing after costs; SAR turned a positive gross year into a -22.70% net year and -94.43% at 25bp. High churn, and the trend family's margin for churn is thin.
The pattern repeats
Net ranking: EMA envelope > ADX > SuperTrend > Chandelier > Aroon > Ichimoku > Vortex > Parabolic SAR. The top four traded 22, 216, 27, and 89 times. The bottom three traded 250, 549, and 525 times. Trend rules that traded rarely won; trend rules that traded constantly lost. In the trend family the edge is real but small per trade — it pays only for trades that are rare enough to be high-conviction.
Code
import pandas as pd
from backtest_base import backtest_signal, metrics
from strategy import STRATEGIES

df = pd.read_pickle("assets/data/binance_BTCUSDT_1h_2023-01-01_2023-12-31.pkl")
trend = ["supertrend", "ichimoku", "chandelier", "adx", "parabolic_sar",
         "aroon", "ema_envelope", "vortex"]

for name in trend:
    spec = STRATEGIES[name]
    signal = spec["func"](df, **spec["params"])
    res = backtest_signal(df, signal, cost_per_leg=0.0005, funding_per_bar=0.0000125)
    m = metrics(res, 8760)
    print(f"{name:<16} {m['total_return']:+9.2%}  trades {m['trades']}")
Reproduce it
cd blog-drafts/scripts
python gen_special_assets.py   # regenerates this chart + all group tables
Data: Binance public API, hourly OHLCV, 8,735 bars. Every number above reproduces from the manifest + post.json of posts 03, 04, 05, 06, 07, 23, 24, 25.
This is a backtest on historical data, not investment advice. Past performance does not predict future results.