The Slippage Session: What 25bp Does to 36 Strategies in One Chart
A 25 basis point cost stack flips the lab: from 26 positive strategies after fees and funding to only 9 positive at 25bp. The nine survivors share one trait — they barely trade. All 36, one chart.
The Slippage Session: What 25bp Does to 36 Strategies in One Chart
Every post in this lab runs the same five cost scenarios, and scenario five — a 0.30%/leg stack (0.05% fee + 0.25% slippage, each leg, both sides) — has quietly produced the most brutal exhibit of the whole series. Time to stop and stare at it. Strategy Lab #41.
The scenario
Each of the 36 strategies ran on the same hourly BTC/USDT 2023 data through the same engine. The "fees + funding" column adds Binance taker fees (0.05%/leg) and hourly funding (0.01% every 8h) while in position. The "25bp" column then assumes you additionally paid 25bp of slippage per leg — which, for a real hourly BTC order book, is optimistic, not pessimistic.
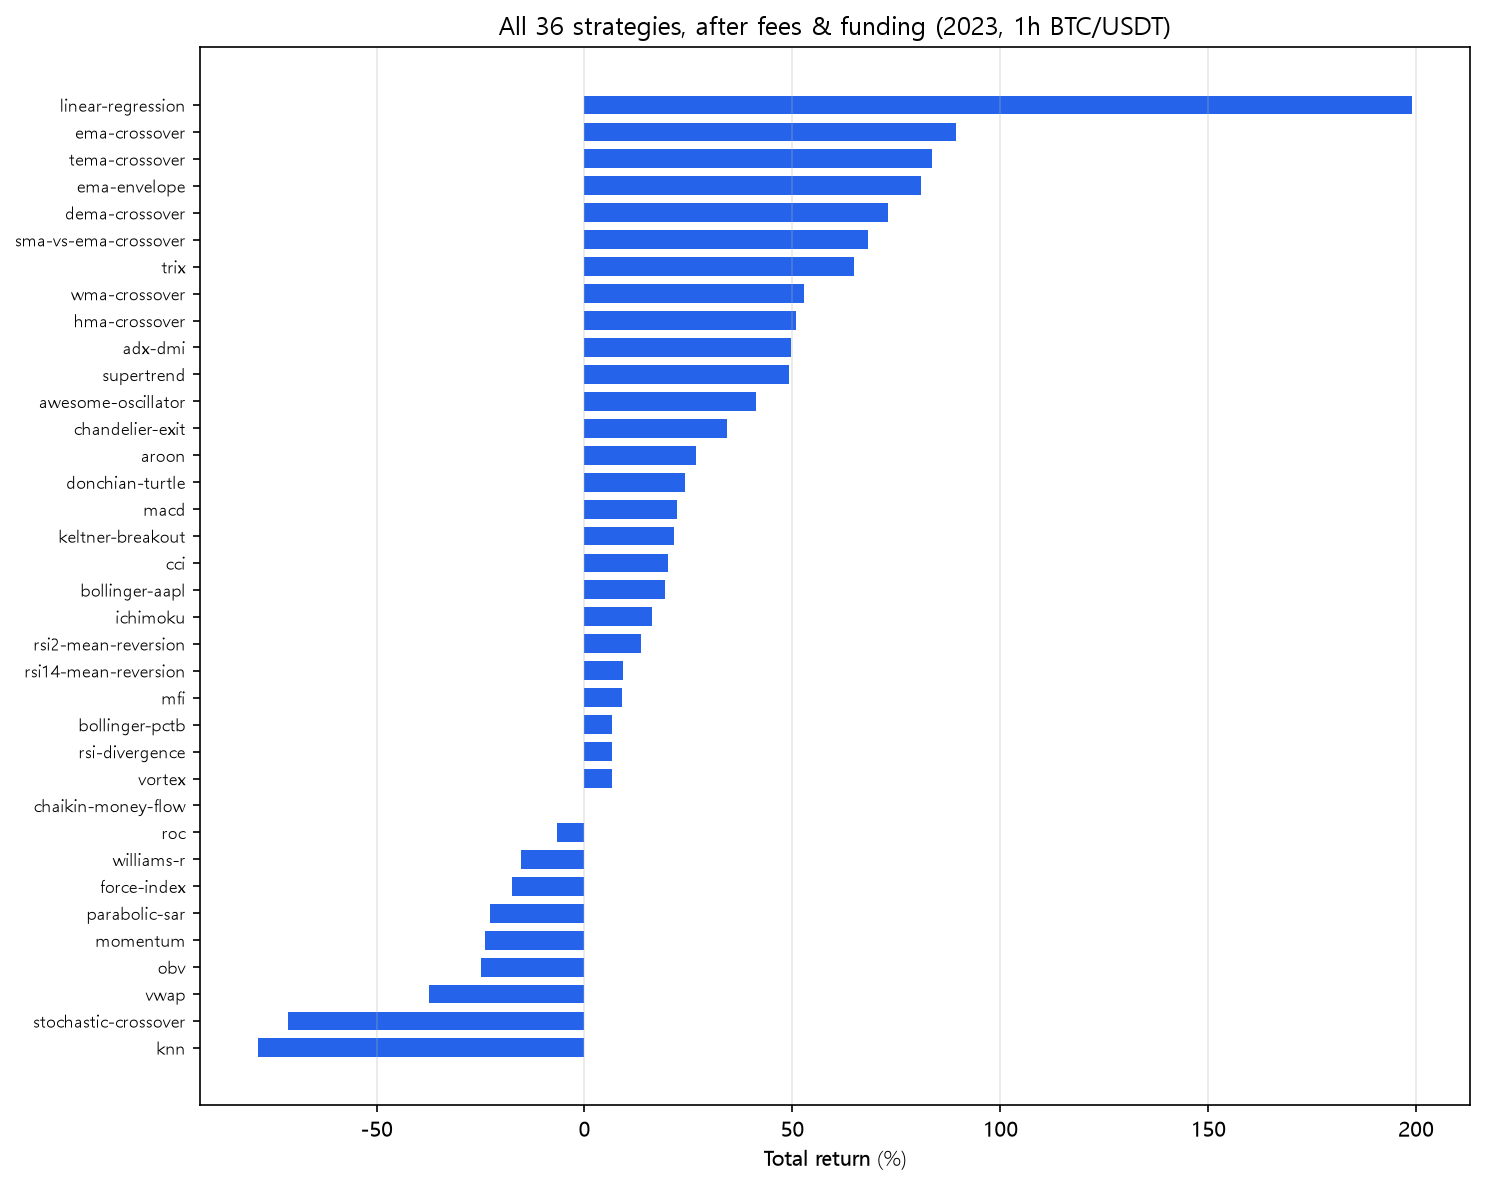
The chart below is all 36 strategies in one ranked bar: net return after fees and funding.
The toll
26 of 36 strategies were net positive after fees and funding. Mean-reversion ideas that any book says are "classic" — Stochastic (+79.05% gross!), VWAP, Williams — collapsed to -71.31%, -37.36%, and -15.19% just from ordinary costs. But 26 survivors is still a passable score.
Then add 25bp per leg, and 9 survive. That's the real line. Of the 36, only 9 stay positive at 25bp:
| # | Strategy | 25bp |
|---|---|---|
| 17 | Linear regression channel | +75.88% |
| 24 | EMA envelope trend | +62.11% |
| 01 | EMA crossover | +51.17% |
| 03 | SuperTrend | +30.32% |
| 02 | SMA crossover | +28.89% |
| 19 | DEMA crossover | +17.09% |
| 22 | WMA crossover | +9.75% |
| 20 | TEMA crossover | +4.45% |
| 11 | Bollinger mean reversion (AAPL) | +3.15% |
Eight trend rules and one very slow reversion. Their shared trait is visible from the scoreboard: the nine survivors traded 22 to 113 times, about 60 on average. Every one of the 18 strategies that traded more than 140 times in 2023 died at 25bp — all 18, without exception. Trading slowly was necessary to survive; it just wasn't sufficient (five slow strategies still lost).
The numbers that should scare you
- -100.00%: Stochastic (1,798 legs × 0.30% = 5.4× the account) and k-NN (1,821 legs). Two strategies returned exactly negative everything.
- -98.51%: Momentum. -98.10%: OBV. -97.19%: ROC. The "volume momentum" family's gross edges (up to +97.20%) were eaten to the last percentage point.
- -93.84%: CMF, whose +84.53% gross turned into -0.00% after fees and funding and -93.84% at 25bp.
What this means in practice
Your real slippage is probably worse than 25bp, not better. The nine survivors at 25bp are the only strategies in this lab that have a margin for your actual fill quality. The other 27 are not "strategies that lose a bit" — they are fee machines wearing the costume of strategies. The takeaway is less about any indicator and more about a budget: a strategy trading 100+ times a year is spending 30+ points of return a year before it has done anything.
Code
import pandas as pd
from backtest_base import backtest_signal, metrics
from strategy import STRATEGIES

df = pd.read_pickle("assets/data/binance_BTCUSDT_1h_2023-01-01_2023-12-31.pkl")

for name in STRATEGIES:
    spec = STRATEGIES[name]
    signal = spec["func"](df, **spec["params"])
    base = metrics(backtest_signal(df, signal, 0.0005, 1.25e-05), 8760)
    tough = metrics(backtest_signal(df, signal, 0.0030, 1.25e-05), 8760)
    if tough["total_return"] > 0:
        print(f"SURVIVED  {name:<16} funded {base['total_return']:+9.2%}  25bp {tough['total_return']:+9.2%}")
Reproduce it
cd blog-drafts/scripts
python gen_special_assets.py   # regenerates this chart + all group tables
Data: Binance public API, hourly OHLCV, 8,735 bars. Scenario definitions are in every post's post.json.
This is a backtest on historical data, not investment advice. Past performance does not predict future results.