SuperTrend Backtest on BTC/USDT: The Indicator That Looks Like a Strategy
SuperTrend is everywhere on TradingView — but is it actually a tradable strategy? Real hourly BTC/USDT backtest with fees and funding: +49.19%, a -41.88% drawdown, and 27 trades. Pandas implementation and charts.
SuperTrend Backtest on BTC/USDT (2023, hourly, real fees)
When I first opened TradingView, SuperTrend was the first thing I put on every single chart. It drew a clean green line under an uptrend and a red line over a downtrend, and it flipped by itself — no decisions required. I genuinely believed I'd found a cheat code. My first SuperTrend script had more comments explaining why it should work than it had actual trading logic. It was a humbling year. Strategy Lab #3.
How SuperTrend actually works
SuperTrend is built from ATR bands around the midpoint of the candle (high + low) / 2:
upper = midpoint + multiplier × ATR(period)lower = midpoint − multiplier × ATR(period)
The trend is up while the close stays above the ratcheting lower band. The lower band only moves up, so it behaves like a trailing stop that tightens in calm conditions and widens during volatility spikes. The trend flips when the close crosses the band — that flip is both your entry and your exit. It's a complete, self-contained strategy wearing an indicator's costume, which is why it's the single most published script family on TradingView.
Data
Same setup as the rest of the series so results are directly comparable:
- BTC/USDT, hourly, 2023 full year (8,735 bars), Binance public API
- Parameters: ATR period 10, multiplier 3 — the defaults everyone starts with
- Taker fee 0.05%/leg, funding 0.01%/8h while holding
Results
| Strategy | Category | Total return | CAGR | MaxDD | Sharpe | Trades |
|---|---|---|---|---|---|---|
| supertrend | trend | +49.19% | +49.36% | -41.88% | 1.38 | 27 |
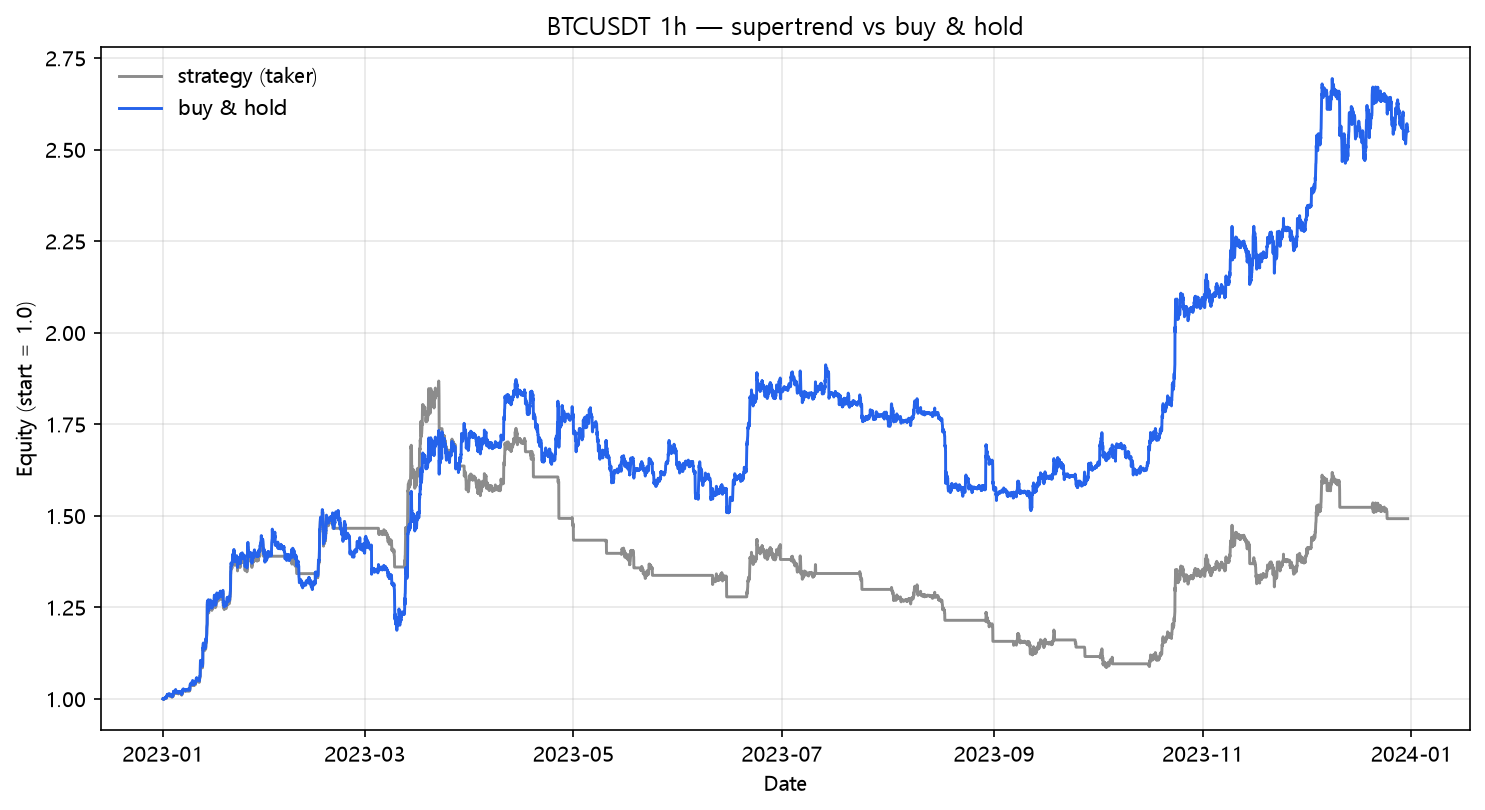
The number that stopped me was not the return — it was the drawdown. -41.88% with only 27 trades. SuperTrend does everything right: few trades, low fees, always in or cleanly out. And it still handed back nearly half the account during the year. A trailing stop that keeps you in a falling trend until it fully reverses is doing its job; the job is just to absorb the whole move down first.
Here is the exact state machine, because the flip rule matters and most copies online get the ratchet slightly wrong:
def supertrend(df, period=10, mult=3.0):
    hl2 = (df["high"] + df["low"]) / 2
    band = atr(df, period) * mult
    upper, lower = hl2 + band, hl2 - band
    trend = np.zeros(len(df), dtype=bool)
    trend[0] = df["close"][0] >= hl2[0]
    for i in range(1, len(df)):
        if df["close"][i] > upper[i - 1]:
            trend[i] = True
        elif df["close"][i] < lower[i - 1]:
            trend[i] = False
        else:
            trend[i] = trend[i - 1]
    return trend
Costs still bite — even at 27 trades
| Scenario | Cost/leg | Total return | MaxDD | Sharpe | Trades |
|---|---|---|---|---|---|
| naive (zero cost) | 0.00% | +62.50% | -39.27% | 1.64 | 27 |
| taker fee 0.05%/leg | 0.05% | +58.17% | -40.41% | 1.56 | 27 |
| + funding 0.01%/8h | 0.05% | +49.19% | -41.88% | 1.38 | 27 |
| + slippage 10bp/leg | 0.15% | +41.34% | -44.05% | 1.22 | 27 |
| + slippage 25bp/leg | 0.30% | +30.32% | -47.28% | 0.97 | 27 |
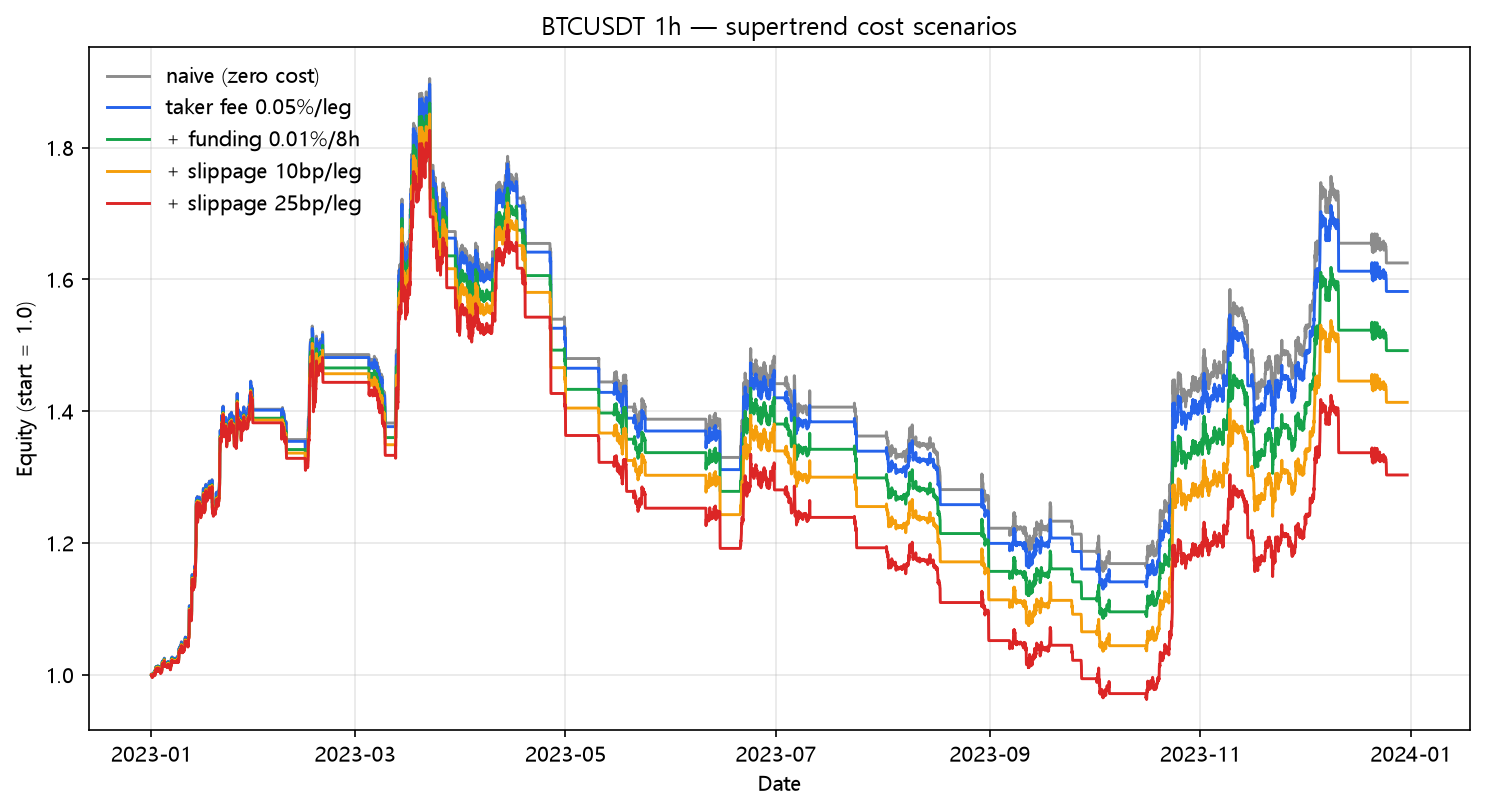
Here's the honest contrast with the crossover posts: SuperTrend trades half as often (27 vs 45) yet loses more to the same costs, because its whole edge is being right on a few big moves — every basis point of slippage lands directly on those. The naive +62.50% looks fine; the +30.32% with a -47.28% drawdown is the version a live account would actually experience.
Buy and hold comparison
| Strategy | Total return | CAGR | MaxDD | Sharpe |
|---|---|---|---|---|
| supertrend | +49.19% | +49.36% | -41.88% | 1.38 |
| buy & hold | +154.94% | +155.62% | -21.74% | 2.42 |
Buy and hold won by every measure except "was the line green when I looked at it." SuperTrend's ATR(10)×3 spent a lot of 2023 slowly flipping around choppy lows, and the multiplier controls the whole personality of this strategy. That sensitivity is exactly what makes the "default" SuperTrend script so dangerous to copy without question.
What this does NOT prove
- 27 trades on one symbol, one year — a whisper of a sample.
- ATR(10)×3 is one point in a huge parameter space. There are SuperTrend settings that beat buy and hold on this data; I'm not going to hunt for them in a "strategy profile" post, because finding them would be the point where overfitting starts.
- The robust lesson isn't the return. It's that an indicator that looks like a strategy still needs stops, sizing and a cost model — the green line doesn't trade for you.
Reproduce it
cd blog-drafts/scripts
python backtest_base.py --strategy supertrend --symbol BTCUSDT --interval 1h \
    --start 2023-01-01 --end 2023-12-31 --fee 0.0005 --funding 0.0000125
Data: Binance public API, hourly OHLCV, 8,735 bars. The tables above reproduce exactly from this command.
This is a backtest on historical data, not investment advice. Past performance does not predict future results.