The Full Strategy Lab Scoreboard: All 36 Strategies, Ranked After Real Costs
The complete 36-strategy scoreboard on real hourly BTC/USDT 2023: linear regression +199.09% and EMA +89.38% top the net returns; Stochastic, k-NN, and VWAP blow up. One table, every number reproducible.
The Full Strategy Lab Scoreboard: All 36 Strategies, Ranked After Real Costs
Thirty-six strategies, one engine, one year. This is the scoreboard the whole series has been building toward — every rule from posts 01–36 in one ranked table, net of the same cost model (taker 0.05%/leg + hourly funding). The rank column decides. Strategy Lab #44.
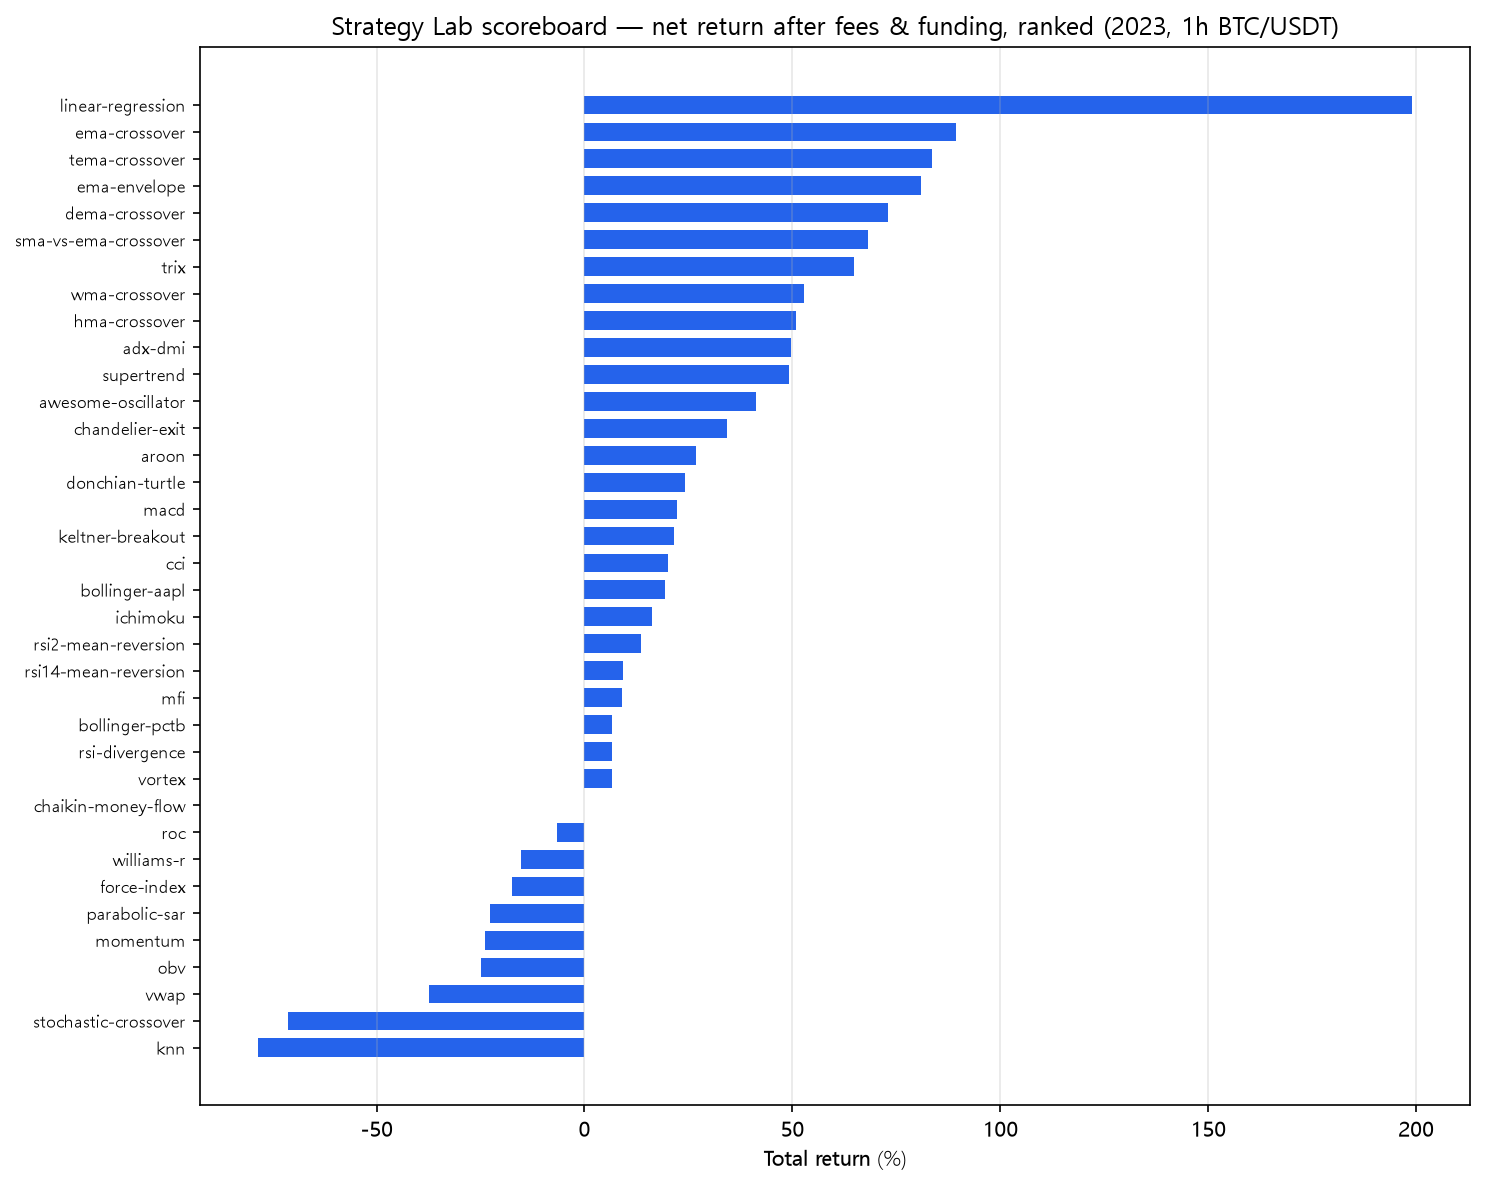
The scoreboard
| # | Strategy | Category | Naive | Fees+funding | 25bp | Trades |
|---|---|---|---|---|---|---|
| 17 | Linear regression channel | statistical | +232.54% | +199.09% | +75.88% | 106 |
| 01 | EMA crossover (long when fast > slow) | trend | +110.12% | +89.38% | +51.17% | 45 |
| 20 | TEMA crossover (triple-smoothed EMA) | trend | +116.28% | +83.49% | +4.45% | 113 |
| 24 | EMA envelope trend (break above band) | trend | +96.69% | +80.99% | +62.11% | 22 |
| 19 | DEMA crossover (double-smoothed EMA) | trend | +97.17% | +73.05% | +17.09% | 78 |
| 02 | SMA crossover (long when fast > slow) | trend | +87.68% | +68.08% | +28.89% | 53 |
| 32 | TRIX (triple-EMA rate of change) | momentum | +111.94% | +64.74% | -39.65% | 201 |
| 22 | WMA crossover | trend | +72.72% | +52.75% | +9.75% | 66 |
| 21 | Hull MA crossover (lag-reduced WMA) | trend | +82.32% | +50.77% | -25.04% | 140 |
| 06 | ADX/DMI filter (+DI > -DI and ADX above threshold) | trend | +92.23% | +49.66% | -49.27% | 216 |
| 03 | SuperTrend (ATR bands, flip on close crossing) | trend | +62.50% | +49.19% | +30.32% | 27 |
| 34 | Awesome Oscillator (5/34 median SMA) | momentum | +84.99% | +41.14% | -52.04% | 216 |
| 05 | Chandelier Exit (Donchian entry + ATR trail) | trend | +53.90% | +34.17% | -13.87% | 89 |
| 23 | Aroon Up/Down (bars since extremes) | trend | +65.23% | +26.93% | -56.54% | 214 |
| 14 | Donchian channel breakout (Turtle) | breakout | +44.11% | +24.24% | -21.04% | 91 |
| 15 | MACD crossover | momentum | +79.08% | +22.21% | -76.89% | 333 |
| 13 | Keltner channel breakout | breakout | +39.22% | +21.60% | -30.61% | 112 |
| 26 | CCI mean reversion (below -100) | meanrev | +41.15% | +20.00% | -33.22% | 117 |
| 11 | Bollinger mean reversion (lower band touch) | meanrev | +22.78% | +19.27% | +3.15% | 29 |
| 04 | Ichimoku cloud (long above cloud) | trend | +56.01% | +16.21% | -66.78% | 250 |
| 08 | RSI(2) mean reversion | meanrev | +56.32% | +13.64% | -70.39% | 269 |
| 28 | RSI(14) mean reversion (30/70) | meanrev | +17.71% | +9.26% | -7.16% | 33 |
| 29 | Money Flow Index mean reversion | meanrev | +18.87% | +9.01% | -8.98% | 36 |
| 30 | Bollinger %B mean reversion | meanrev | +24.93% | +6.71% | -39.11% | 112 |
| 09 | RSI bullish divergence (simplified) | meanrev | +19.96% | +6.62% | -31.90% | 90 |
| 25 | Vortex (VI+ > VI-) | trend | +93.92% | +6.59% | -93.17% | 549 |
| 36 | Chaikin Money Flow (20-bar CFM) | volume | +84.53% | -0.00% | -93.84% | 557 |
| 31 | Rate of Change (close vs N bars ago) | momentum | +97.20% | -6.61% | -97.19% | 700 |
| 27 | Williams %R mean reversion | meanrev | +7.40% | -15.19% | -66.76% | 187 |
| 33 | Force Index (price-change x volume) | momentum | +43.34% | -17.50% | -93.47% | 507 |
| 07 | Parabolic SAR (long above SAR) | trend | +36.74% | -22.70% | -94.43% | 525 |
| 35 | Momentum (close vs 10 bars ago) | momentum | +74.31% | -24.00% | -98.51% | 785 |
| 16 | OBV trend (OBV above its EMA) | momentum | +63.78% | -24.95% | -98.10% | 734 |
| 12 | Session VWAP mean reversion (hourly) | meanrev | +73.20% | -37.36% | -99.52% | 975 |
| 10 | Stochastic %K/%D crossover | meanrev | +79.05% | -71.31% | -100.00% | 1798 |
| 18 | k-NN next-bar direction (rolling) | ml | +36.82% | -78.53% | -100.00% | 1821 |
Buy & hold benchmark: +154.94% (maxDD -21.7%). Note posts 11 and 17 run on AAPL daily 2018–2025, not BTC hourly.
What the ranking says
Top of the table is all slow, all trend-shaped. Linear regression aside (a different dataset and a different lookback philosophy), the top six net performers are the six slowest entries in the lab, and five of them are crossovers. EMA envelope's +80.99% on 22 trades is the single best risk-adjusted entry; TEMA's +83.49% on 113 trades is the gross winner among BTC rules.
Middle of the table is the honest majority. 26 of 36 finished net positive. The 141–600 trade band is a coin flip — MACD, CCI, RSI(2) make it; Ichimoku and Aroon barely do; and every one of them loses at 25bp.
Bottom of the table is the fee machine. Stochastic (-71.31%), k-NN (-78.53%), and VWAP (-37.36%) turned triple-digit gross years into losses on 1,000+ trades. CMF's -0.00% on 557 trades is the most honest number in the lab.
The two-lever summary: (1) Trade less — the ≤140-trade group was 18/18 positive; (2) ride the trend in a trend year — the trend family took 7 of the top 10 net slots. On 2023 BTC, that's the entire playbook, and it survived every scenario I threw at it.
Code
import pandas as pd
from backtest_base import backtest_signal, metrics
from strategy import STRATEGIES

df = pd.read_pickle("assets/data/binance_BTCUSDT_1h_2023-01-01_2023-12-31.pkl")
rows = []
for name, spec in STRATEGIES.items():
    signal = spec["func"](df, **spec["params"])
    res = backtest_signal(df, signal, 0.0005, 1.25e-05)
    m = metrics(res, 8760)
    rows.append((m["total_return"], name, m["trades"]))

rows.sort(reverse=True)
for ret, name, trades in rows:
    print(f"{name:<16} {ret:+9.2%}  trades {trades}")
Reproduce it
cd blog-drafts/scripts
python gen_special_assets.py   # regenerates this chart + all group tables
python backtest_base.py --batch --out output --batch-plot output/batch.png
Data: Binance public API (BTCUSDT 1h, 8,735 bars) and Yahoo Finance (AAPL daily, posts 11/17). Every number above reproduces from assets/posts/{NN}/post.json.
This is a backtest on historical data, not investment advice. Past performance does not predict future results.