StochRSI Backtest on BTC/USDT: The Double-Oscillator That Couldn't Quite
StochRSI (14,14) mean reversion on real hourly BTC/USDT 2023: +37.46% naive, -6.61% after fees and funding, -83.74% at 25bp across 349 trades. A double-smoothing of RSI that still trades too much.
StochRSI Backtest on BTC/USDT (2023, hourly, real fees)
StochRSI is the mean-reversion family's double-smoothing experiment: you take RSI and run a Stochastic on it. The idea is that the second layer of smoothing cuts the noise that plagues a raw oscillator. It traded 349 times in 2023 — the smallest number in the fast-reversion family — and it still couldn't pay its own way. Strategy Lab #46.
The setup
StochRSI = (RSI(14) − 14-period RSI low) / (14-period RSI high − low). Long when StochRSI rises back above 0.2 (bought under 0.2), exit when it closes above 0.8. Same engine, same cost model as the rest of the series.
Results
| Strategy | Category | Total return | CAGR | MaxDD | Sharpe | Trades |
|---|---|---|---|---|---|---|
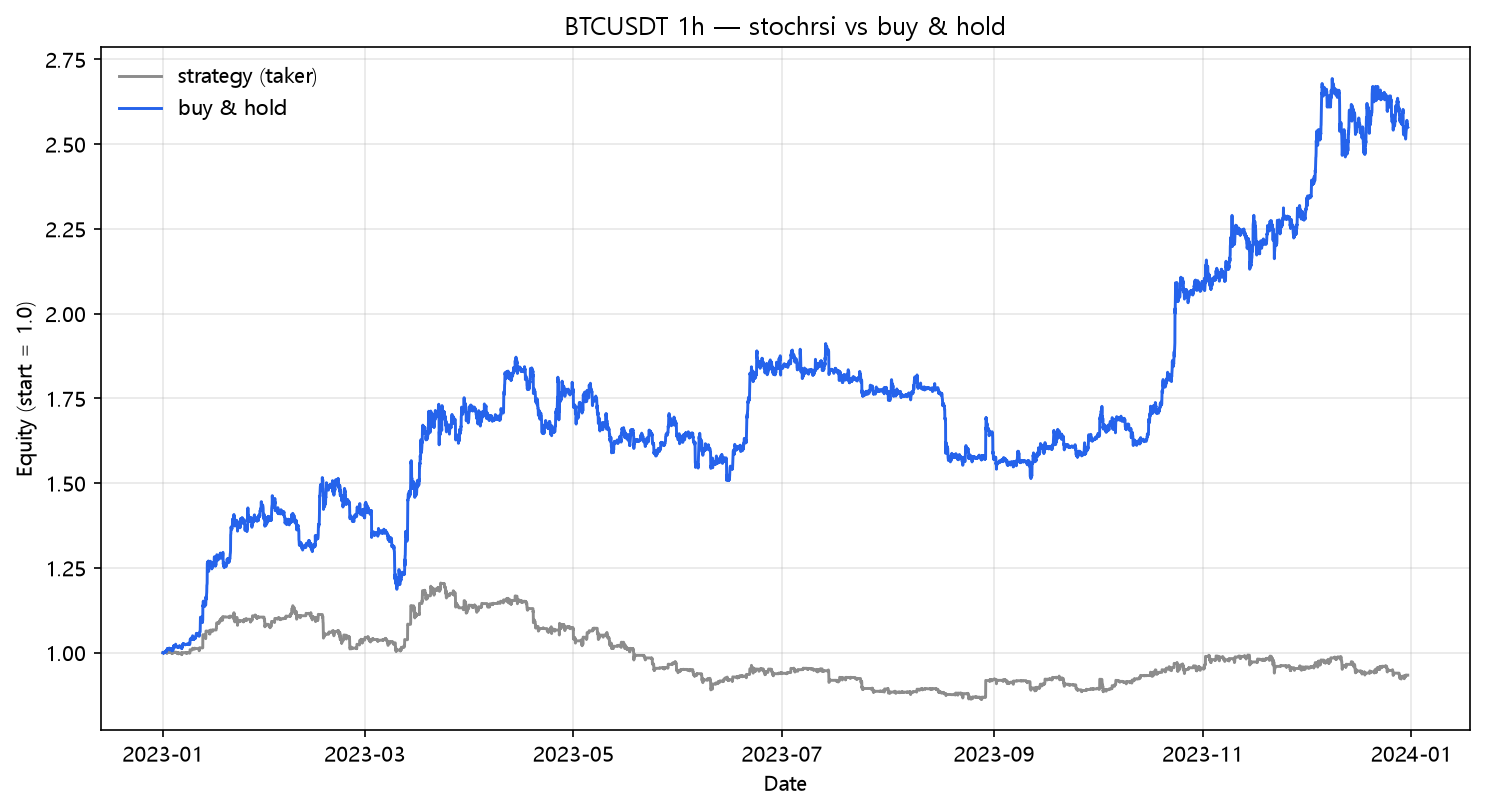
| stochrsi | meanrev | -6.61% | -6.61% | -28.47% | -0.17 | 349 |
A slow mean reversion that still failed
RSI(2) (post 08) traded 269 times and made +13.64% net. RSI(14) (post 28) traded 33 times and made +9.26%. StochRSI sits between them at 349 trades and made -6.61% — the double smoothing filtered some noise but not enough, and 349 round trips is still 35 points of fee cost a year.
The reversion bench from post 38 gets a new data point and the conclusion holds: in the reversion family the trade count is destiny. The table:
| Strategy | Trades | Naive | Fees+funding | 25bp |
|---|---|---|---|---|
| Stochastic (post 10) | 1,798 | +79.05% | -71.31% | -100.00% |
| VWAP (post 12) | 975 | +73.20% | -37.36% | -99.52% |
| Williams %R (post 27) | 187 | +7.40% | -15.19% | -66.76% |
| StochRSI (this) | 349 | +37.46% | -6.61% | -83.74% |
| RSI(2) (post 08) | 269 | +56.32% | +13.64% | -70.39% |
| CCI (post 26) | 117 | +41.15% | +20.00% | -33.22% |
| RSI(14) (post 28) | 33 | +17.71% | +9.26% | -7.16% |
The fee bill
| Scenario | Cost/leg | Total return | MaxDD | Sharpe | Trades | |---|---:|---:|---:|---:|---:|---:| | naive (zero cost) | 0.00% | +37.46% | -20.33% | 1.46 | 349 | | taker fee 0.05%/leg | 0.05% | -3.05% | -27.29% | -0.01 | 349 | | + funding 0.01%/8h | 0.05% | -6.61% | -28.47% | -0.17 | 349 | | + slippage 10bp/leg | 0.15% | -53.56% | -57.09% | -3.06 | 349 | | + slippage 25bp/leg | 0.30% | -83.74% | -84.02% | -7.15 | 349 |
The naive equity is genuinely nice — +37.46% with a -20.3% drawdown and Sharpe 1.46. Then the 349 trades turn it negative with ordinary fees. This is the cleanest demonstration in the reversion family that a good-looking gross curve and a negative net curve are one trade-count apart.
What this does NOT prove
- The 0.2/0.8 thresholds are the standard defaults. A wider 0.1/0.9 band would trade less — and, following the lab's own pattern, probably survive better (RSI14's 33 trades are the proof of direction).
- StochRSI as an entry filter on top of a trend rule (the common professional use) is not what this test measures.
- One pair, one year, one regime. In a choppy 2024 the reversion family would likely rank far higher; the frequency ranking within the family is what generalizes.
Code
from backtest_base import fetch, backtest_signal, metrics, rsi

df = fetch("BTCUSDT", "binance", "2023-01-01", "2023-12-31", "1h")
r = rsi(df["close"], 14)
ll = r.rolling(14).min()
hh = r.rolling(14).max()
srsi = (r - ll) / (hh - ll)

signal = srsi > 0.2  # stateful: entered below 0.2, exit above 0.8
# (full stateful version lives in strategy.py: sig_stochrsi)
from strategy import sig_stochrsi
signal = sig_stochrsi(df)

res = backtest_signal(df, signal, cost_per_leg=0.0005, funding_per_bar=0.0000125)
print(metrics(res, 8760))
Reproduce it
cd blog-drafts/scripts
python gen_post_assets.py --ids 46
Data: Binance public API, hourly OHLCV, 8,735 bars. Tables above reproduce exactly from this command.
This is a backtest on historical data, not investment advice. Past performance does not predict future results.