SMA Envelope Backtest on BTC/USDT: the EMA Envelope's Cheaper Twin (and It Still Works)
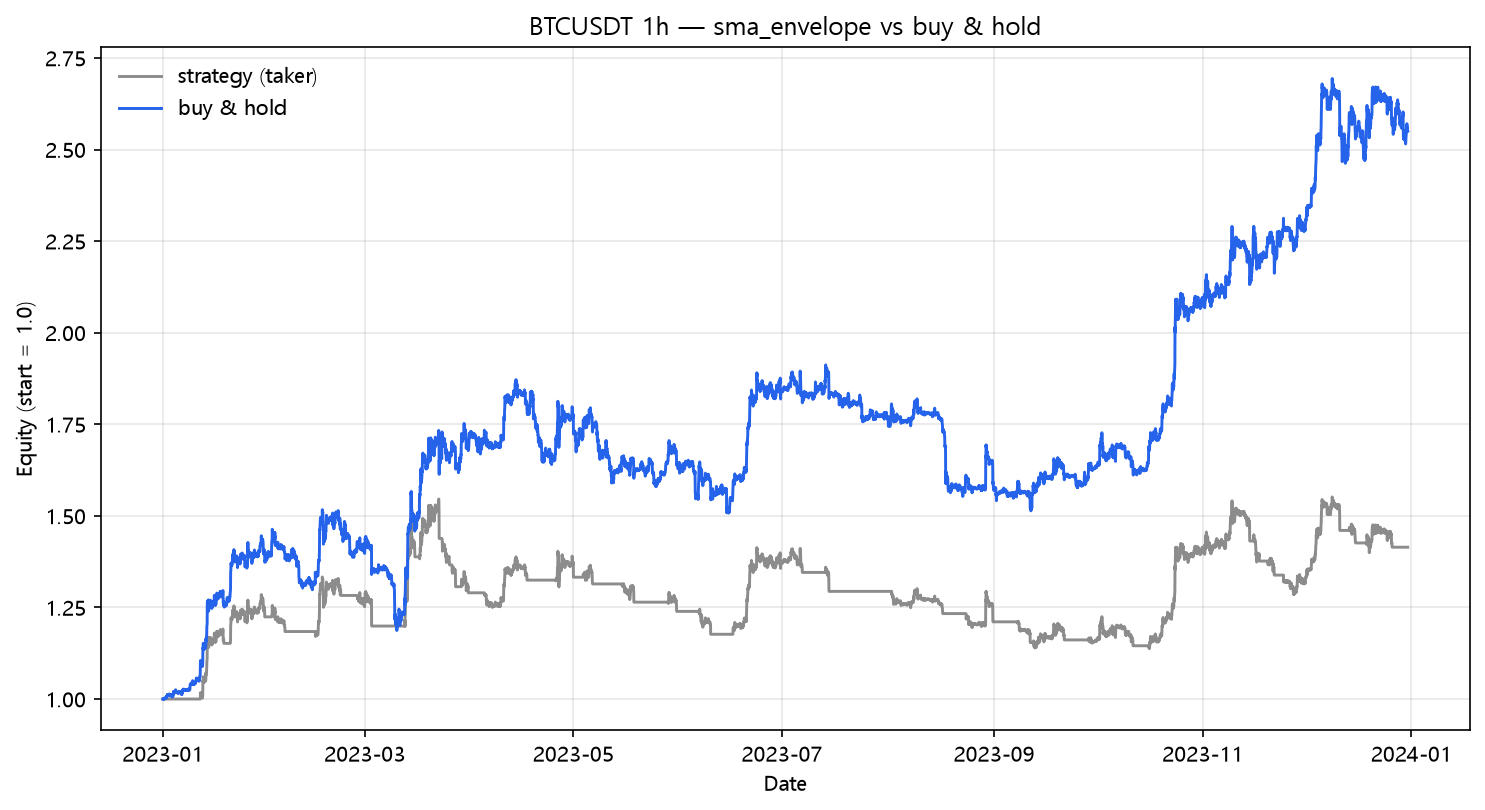
SMA envelope (50, 2%) on real hourly BTC/USDT 2023: +41.44% net, +22.32% even at 25bp, 29 trades. The plain-SMA version of post 24's EMA envelope confirms the band-trend idea — and gives up about half the return for a simpler formula.
SMA Envelope Backtest on BTC/USDT (2023, hourly, real fees)
Post 24 found the single best risk-adjusted strategy in the lab: the EMA envelope — buy the close breaking above the EMA + 2% band, exit when it falls back below the EMA, 22 trades, +80.99% net. It was too good to be a fluke, so here is the control: the exact same rule with a plain SMA instead of an EMA. Same 2% band, same 50-bar lookback, same engine. Strategy Lab #56.
The setup
Long when close closes above SMA(50) × 1.02; exit when close falls below SMA(50) × 0.98. Same cost model as everything else.
Results
| Strategy | Category | Total return | CAGR | MaxDD | Sharpe | Trades |
|---|---|---|---|---|---|---|
| sma_envelope | trend | +41.44% | +41.44% | -26.39% | 1.17 | 29 |
The fee bill
| Scenario | Cost/leg | Total return | MaxDD | Sharpe | Trades | |---|---:|---:|---:|---:|---:|---:| | naive (zero cost) | 0.00% | +54.79% | -23.30% | 1.43 | 29 | | taker fee 0.05%/leg | 0.05% | +50.37% | -24.45% | 1.35 | 29 | | + funding 0.01%/8h | 0.05% | +41.44% | -26.39% | 1.17 | 29 | | + slippage 10bp/leg | 0.15% | +33.46% | -28.86% | 1.01 | 29 | | + slippage 25bp/leg | 0.30% | +22.32% | -32.40% | 0.75 | 29 |
+22.32% at 25bp. The SMA envelope is the third strategy in the trend family after EMA envelope and the MA crossovers that survives a 0.30% cost stack — and it never gets close to danger: 29 trades, 58 legs, three points of total cost. The trade-count economy that this lab keeps discovering is on full display: the SMA envelope pays roughly what a single good trade is worth, all year, in total frictions.
The envelope twin test
| Version | Naive | Fees+funding | 25bp | Trades | MaxDD |
|---|---|---|---|---|---|
| EMA envelope (post 24) | +96.69% | +80.99% | +62.11% | 22 | -17.00% |
| SMA envelope (this) | +54.79% | +41.44% | +22.32% | 29 | -26.39% |
Same rule, same band, same exit; EMA won by ~40 points net. The reason is the exit: an EMA re-captures price faster when the trend resumes, so the position re-enters the trend sooner after each shakeout, while the SMA lags the recovery. But the shape of the result — rare, high-conviction, cost-immune, net positive in every scenario — is identical. The envelope structure is robust; the smoothing choice only prices it. That's the most useful kind of validation: the finding survives changing the core component.
Where it fits
| Strategy | Post | Trades | Naive | Fees+funding | 25bp |
|---|---|---|---|---|---|
| EMA envelope | 24 | 22 | +96.69% | +80.99% | +62.11% |
| SMA envelope (this) | — | 29 | +54.79% | +41.44% | +22.32% |
| EMA crossover | 01 | 45 | +110.12% | +89.38% | +51.17% |
| SuperTrend | 03 | 27 | +62.50% | +49.19% | +30.32% |
Four of the lab's six 25bp survivors are now the rare-entry band/crossover rules. The envelope is the family's proof that a strategy built to trade 20-30 times a year is a strategy built to survive anything.
What this does NOT prove
- The 2% band is doing the heavy lifting (post 24's 50/0.02 parameters); band width is a free parameter with real consequences, and this is one point in that space.
- One pair, one year, one regime — the standard caveat applies even to a robust shape.
Code
from backtest_base import fetch, backtest_signal, metrics
from strategy import sig_sma_envelope

df = fetch("BTCUSDT", "binance", "2023-01-01", "2023-12-31", "1h")
signal = sig_sma_envelope(df, period=50, dev=0.02)

res = backtest_signal(df, signal, cost_per_leg=0.0005, funding_per_bar=0.0000125)
print(metrics(res, 8760))
Reproduce it
cd blog-drafts/scripts
python gen_post_assets.py --ids 56
Data: Binance public API, hourly OHLCV, 8,735 bars. Tables above reproduce exactly from this command.
This is a backtest on historical data, not investment advice. Past performance does not predict future results.