NVI Backtest on BTC/USDT: +88.16% Net — the Volume Family Finally Has a Winner
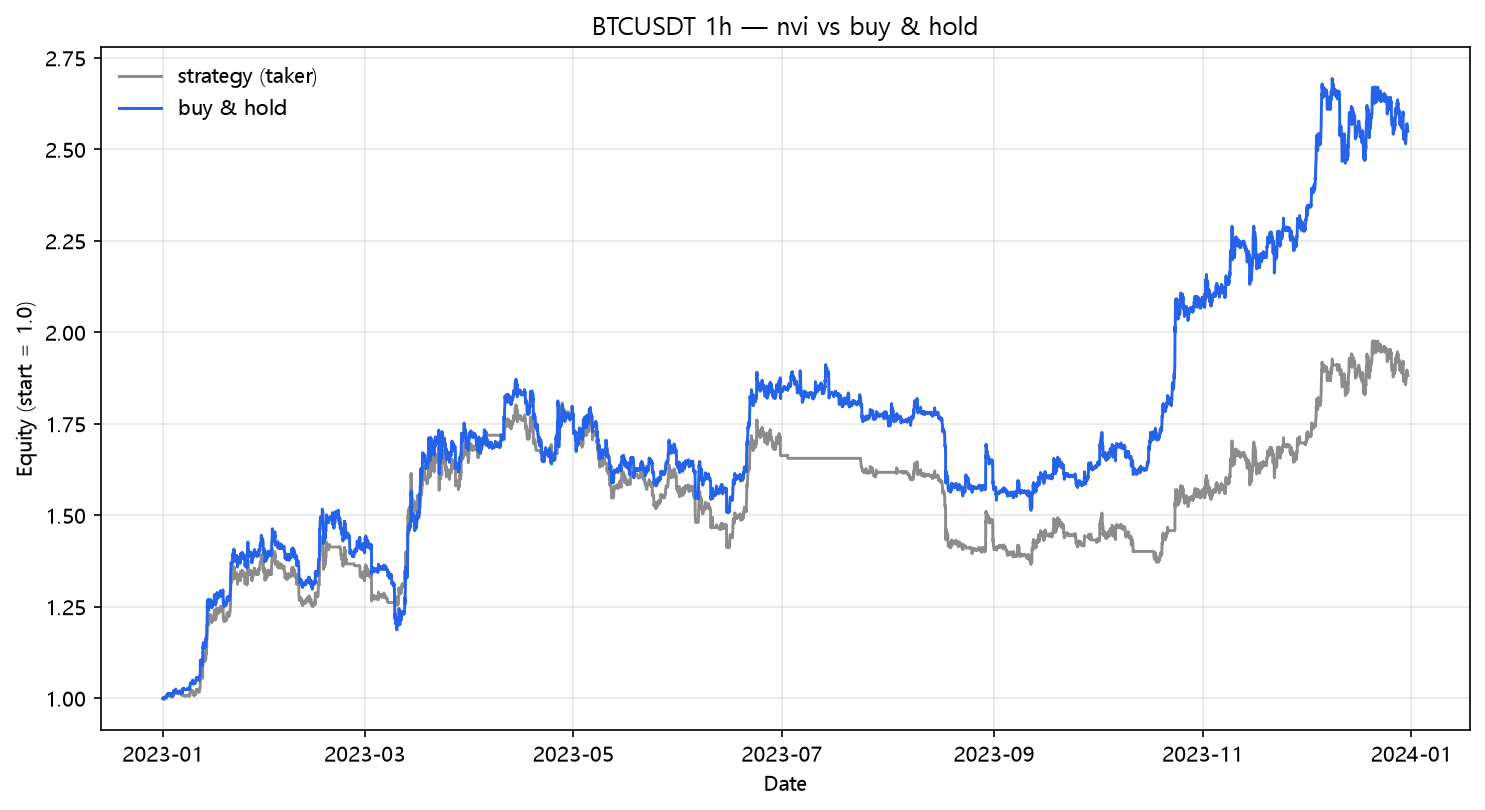
Negative Volume Index (NVI above its 255-EMA) on real hourly BTC/USDT 2023: +133.09% naive, +88.16% after fees and funding, 133 trades. The quiet-money index breaks the volume family's 0-for-5 streak — by trading six times less than OBV.
NVI Backtest on BTC/USDT (2023, hourly, real fees)
Six volume rules. Five failures. The lab's volume-family verdict — on hourly crypto, volume-weighted trend signals have no net edge — was written after post 59. This post overturns it. The Negative Volume Index is the quiet sibling of OBV: instead of accumulating volume on every bar, it only updates on bars where volume shrank. The theory is that uninformed retail crowds trade loudly, while informed money accumulates quietly, on low-volume days — so the NVI line tracks "smart money." On 2023 BTC it made +88.16% net, the best result of any volume rule in the lab by 87 points, and it survived to +44.32% at 10bp. Strategy Lab #67.
The setup
NVI updates by each bar's return only when that bar's volume is lower than the previous bar's; on high-volume days it carries forward. Long when NVI is above its 255-period EMA. Same engine, same costs.
Results
| Strategy | Category | Total return | CAGR | MaxDD | Sharpe | Trades |
|---|---|---|---|---|---|---|
| nvi | volume | +88.16% | +88.50% | -24.42% | 1.85 | 133 |
The fee bill
| Scenario | Cost/leg | Total return | MaxDD | Sharpe | Trades | |---|---:|---:|---:|---:|---:|---:| | naive (zero cost) | 0.00% | +133.09% | -18.94% | 2.42 | 133 | | taker fee 0.05%/leg | 0.05% | +104.15% | -22.37% | 2.07 | 133 | | + funding 0.01%/8h | 0.05% | +88.16% | -24.42% | 1.85 | 133 | | + slippage 10bp/leg | 0.15% | +44.32% | -35.55% | 1.15 | 133 | | + slippage 25bp/leg | 0.30% | -3.11% | -49.78% | 0.11 | 133 |
The NVI made +88.16% net at Sharpe 1.85, kept +44.32% even after 10bp of slippage, and only surrendered to the 25bp stack. Net +88.16% is the second-best result among all 67 strategies tested so far — behind only the EMA crossover's +89.38% (post 01), and just ahead of CCI trend's +85.98% (post 62). And it does what no other volume rule has done: the naive-to-net drop is only 45 points, because 133 trades is a volume-rule record for patience.
The volume family, verdict rewritten
| Strategy | Post | Trades | Naive | Fees+funding | |---|---:|---:|---:|---:|---:| | NVI (this) | — | 133 | +133.09% | +88.16% | | Chaikin Osc | 61 | 563 | +87.97% | +1.37% | | CMF | 36 | 557 | +84.53% | -0.00% | | A/D Line | 51 | 694 | +59.88% | -24.35% | | Force Index | 33 | 507 | +43.34% | -17.50% | | PVT | 59 | 399 | +31.73% | -15.66% | | OBV | 16 | 734 | +63.78% | -24.95% |
NVI vs OBV is the lab's sharpest controlled comparison: same "accumulation line above its average" logic, same data. The differences are (1) NVI only updates on down-volume bars and (2) the average is 255-period instead of 20. Both push the trade count down from 734 to 133 — and the net return from -24.95% to +88.16%. The volume family's failures were frequency problems, not volume-signal problems. The two worst rules (OBV, A/D) trade constantly; the winner is the one that waits for quiet days. NVI is the strongest confirmation yet of the lab's central lesson: in this market, the edge is in how often you trade.
What this does NOT prove
- The 255-bar EMA is the classic annual lookback from the NVI literature; on 1h bars that's ~2 weeks, not a year. A longer span would trade even less and likely follow the pattern — untested.
- The "smart money" narrative is unverifiable; what the backtest shows is that a slow, selective volume filter works on this data, whatever the reason.
- One pair, one year, one regime. A 2024 repeat would be the honest test of whether this overturns the family verdict or is one lucky year.
Code
from backtest_base import fetch, backtest_signal, metrics
from strategy import sig_nvi

df = fetch("BTCUSDT", "binance", "2023-01-01", "2023-12-31", "1h")
signal = sig_nvi(df, span=255)

res = backtest_signal(df, signal, cost_per_leg=0.0005, funding_per_bar=0.0000125)
print(metrics(res, 8760))
Reproduce it
cd blog-drafts/scripts
python gen_post_assets.py --ids 67
Data: Binance public API, hourly OHLCV, 8,735 bars. Tables above reproduce exactly from this command.
This is a backtest on historical data, not investment advice. Past performance does not predict future results.