KAMA Crossover Backtest on BTC/USDT: +67.40% Net — the Adaptive MA Holds Its Own
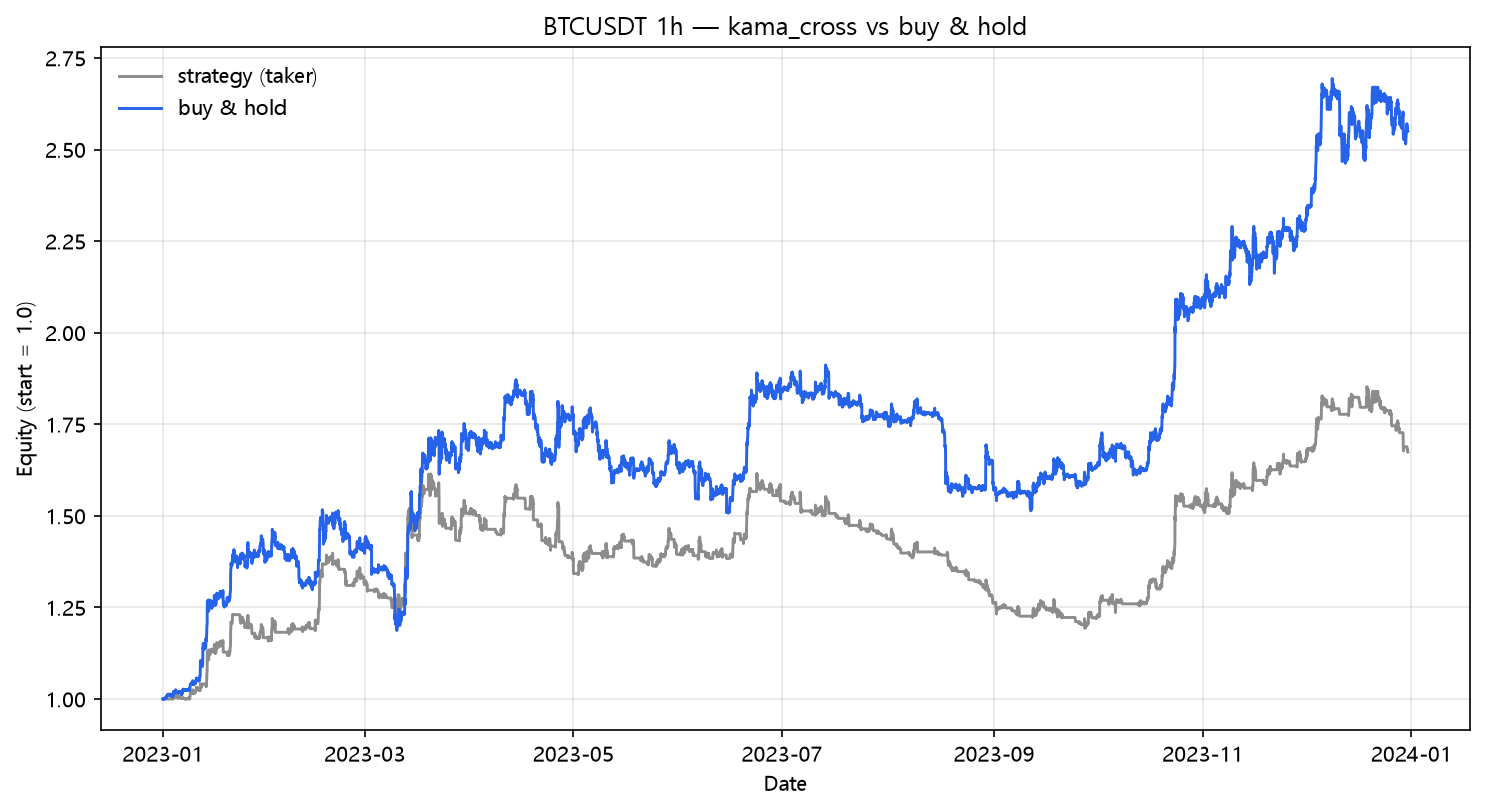
Kaufman Adaptive MA crossover (10/30) on real hourly BTC/USDT 2023: +107.57% naive, +67.40% after fees and funding, 160 trades. The adaptive MA's chop-filtering earns a mid-table spot among six crossover variants.
KAMA Crossover Backtest on BTC/USDT (2023, hourly, real fees)
Perry Kaufman built the Adaptive Moving Average to solve the crossover family's oldest problem: a fixed fast/slow pair is too slow in trends and too fast in chop. KAMA changes its own speed using the Efficiency Ratio — how much price moved net vs how far it traveled. In a strong trend it accelerates to hug price; in sideways chop it slows down to ignore noise. The lab already ran five crossover variants (posts 01, 02, 19, 20, 21, 22). KAMA slots in at +67.40% net, mid-table. Strategy Lab #65.
The setup
KAMA(10) versus KAMA(30), both with an efficiency-ratio speed of 10 bars. Long when the fast adaptive MA is above the slow one. Same engine, same costs.
Results
| Strategy | Category | Total return | CAGR | MaxDD | Sharpe | Trades |
|---|---|---|---|---|---|---|
| kama_cross | trend | +67.40% | +67.64% | -26.13% | 1.76 | 160 |
The fee bill
| Scenario | Cost/leg | Total return | MaxDD | Sharpe | Trades | |---|---:|---:|---:|---:|---:|---:| | naive (zero cost) | 0.00% | +107.57% | -21.73% | 2.43 | 160 | | taker fee 0.05%/leg | 0.05% | +76.96% | -25.17% | 1.93 | 160 | | + funding 0.01%/8h | 0.05% | +67.40% | -26.13% | 1.76 | 160 | | + slippage 10bp/leg | 0.15% | +21.64% | -37.92% | 0.77 | 160 | | + slippage 25bp/leg | 0.30% | -24.70% | -52.21% | -0.71 | 160 |
KAMA delivers exactly what it promises: it trades far more than the EMA crossover (160 vs 45) yet still nets +67.40%, because it is faster into trends and quieter in chop. Its +107.57% gross trails only TEMA (+116.28%) and EMA (+110.12%). Its weakness is the standard one — 160 trades means 25bp slippage costs 32 points, and the -24.70% 25bp result is the crossover family's worst.
The crossover bake-off, complete
| Variant | Post | Trades | Naive | Fees+funding | 25bp | |---|---:|---:|---:|---:|---:|---:| | EMA | 01 | 45 | +110.12% | +89.38% | +51.17% | | TEMA | 20 | 113 | +116.28% | +83.49% | +4.45% | | DEMA | 19 | 78 | +97.17% | +73.05% | +17.09% | | SMA | 02 | 53 | +87.68% | +68.08% | +28.89% | | KAMA (this) | — | 160 | +107.57% | +67.40% | -24.70% | | WMA | 22 | 66 | +72.72% | +52.75% | +9.75% | | HMA | 21 | 140 | +82.32% | +50.77% | -25.04% |
EMA trades the least (45) and keeps the most; TEMA's extra smoothing and a strong gross edge get it second place despite trading 113 times. KAMA's adaptive cleverness nets it mid-table: its +107.57% gross is the second-best of the family, but it trades more than any other variant and pays for it — the family's only negative 25bp result is KAMA's. The trend is clear but not absolute: net return generally falls as trade count rises (EMA 45tr → HMA 140tr), and KAMA is a genuinely good middle ground rather than the magic it's sometimes marketed as.
What this does NOT prove
- The KAMA parameters here (10/30, efficiency 10) are common but not universal; the smoothing constant pair changes the trade count more than the direction of the result.
- KAMA is also used as a trailing-stop base and a standalone trend filter — both untested here.
- One pair, one year, one regime.
Code
from backtest_base import fetch, backtest_signal, metrics
from strategy import sig_kama_cross

df = fetch("BTCUSDT", "binance", "2023-01-01", "2023-12-31", "1h")
signal = sig_kama_cross(df, fast=10, slow=30, er_period=10)

res = backtest_signal(df, signal, cost_per_leg=0.0005, funding_per_bar=0.0000125)
print(metrics(res, 8760))
Reproduce it
cd blog-drafts/scripts
python gen_post_assets.py --ids 65
Data: Binance public API, hourly OHLCV, 8,735 bars. Tables above reproduce exactly from this command.
This is a backtest on historical data, not investment advice. Past performance does not predict future results.