Chaikin Oscillator Backtest on BTC/USDT: the Volume Family's Best Net Result (Still Only +1.37%)
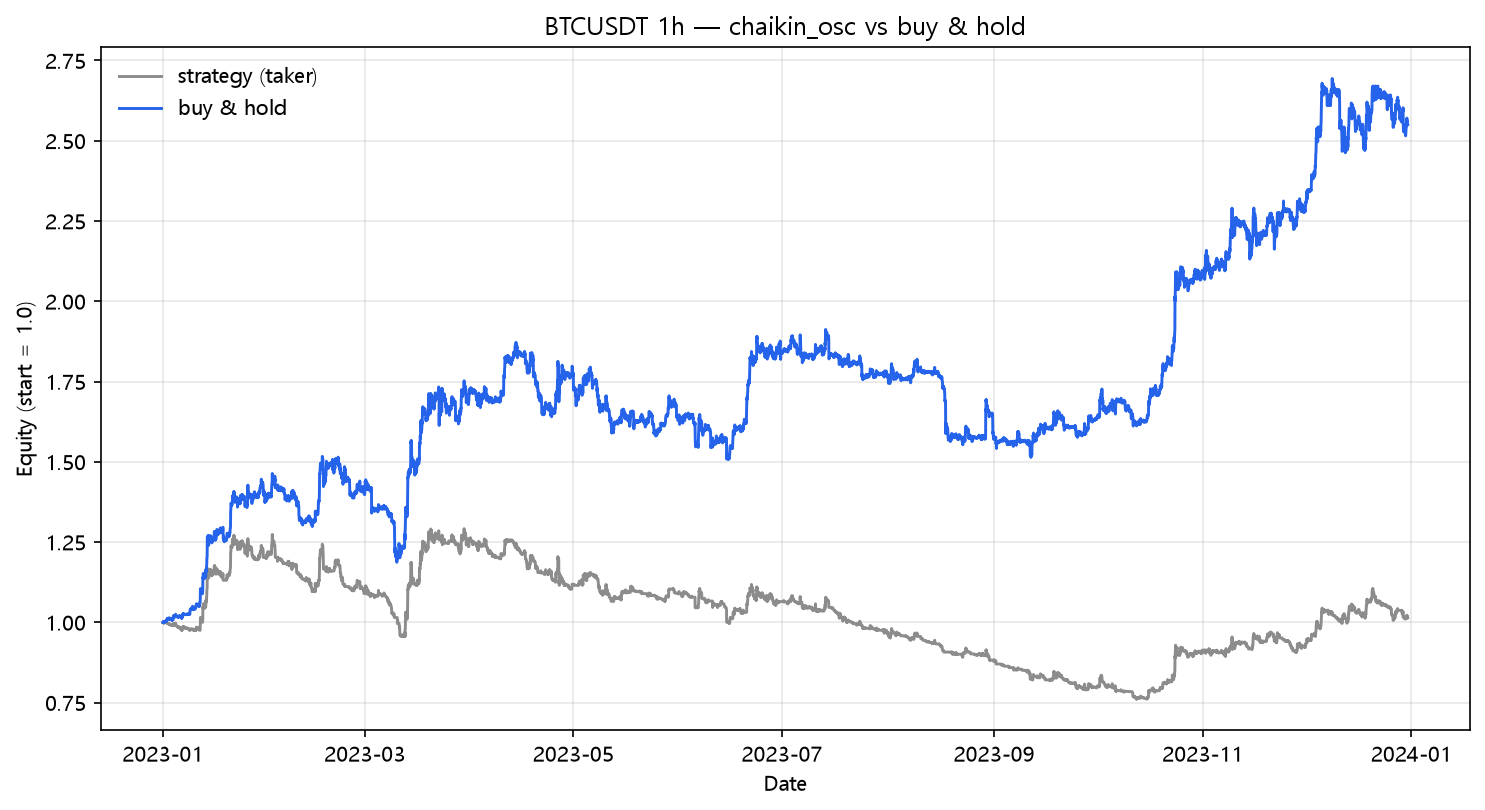
Chaikin Oscillator (A/D EMA 3-10) on real hourly BTC/USDT 2023: +87.97% naive, +1.37% after fees and funding across 563 trades. The smoothest volume rule in the lab — and the first volume trend rule to stay net-positive.
Chaikin Oscillator Backtest on BTC/USDT (2023, hourly, real fees)
Post 51 tested the raw Accumulation/Distribution line against its EMA and it lost 24.35%. The Chaikin Oscillator is the same A/D line, but instead of one EMA it takes the difference of two — EMA(3) minus EMA(10) — which smooths the signal and, crucially, re-centers it so the long rule is "the flow is accelerating up," not just "the cumulative line is above an average." It is the smoothest volume signal in the lab. And it produced the volume family's first net-positive trend result: +1.37%. Strategy Lab #61.
The setup
Chaikin Oscillator = EMA(3) of the A/D line − EMA(10) of the A/D line. Long when it is positive. Same engine, same costs.
Results
| Strategy | Category | Total return | CAGR | MaxDD | Sharpe | Trades |
|---|---|---|---|---|---|---|
| chaikin_osc | volume | +1.37% | +1.38% | -41.16% | 0.21 | 563 |
The fee bill
| Scenario | Cost/leg | Total return | MaxDD | Sharpe | Trades | |---|---:|---:|---:|---:|---:|---:| | naive (zero cost) | 0.00% | +87.97% | -19.84% | 2.05 | 563 | | taker fee 0.05%/leg | 0.05% | +7.08% | -39.61% | 0.37 | 563 | | + funding 0.01%/8h | 0.05% | +1.37% | -41.16% | 0.21 | 563 | | + slippage 10bp/leg | 0.15% | -67.13% | -73.84% | -3.11 | 563 | | + slippage 25bp/leg | 0.30% | -93.94% | -94.43% | -7.87 | 563 |
The Chaikin Oscillator was +87.97% before costs and +1.37% after — 86.6 points of the gross return were fees and funding, on a strategy that traded 563 times. That is the entire story, and it is the same story the volume family has told five times now, with one difference: the smoothed version did not end negative.
The volume family, with the smoothing variable isolated
| Strategy | Post | Trades | Naive | Fees+funding | |---|---:|---:|---:|---:|---:| | Chaikin Osc (this) | — | 563 | +87.97% | +1.37% | | PVT | 59 | 399 | +31.73% | -15.66% | | CMF | 36 | 557 | +84.53% | -0.00% | | A/D Line | 51 | 694 | +59.88% | -24.35% | | Force Index | 33 | 507 | +43.34% | -17.50% | | OBV | 16 | 734 | +63.78% | -24.95% |
A/D vs Chaikin is the cleanest controlled comparison in this table: same underlying accumulation line, same data, one difference (single EMA vs EMA-difference). The raw line lost -24.35%; the smoothed oscillator lost essentially nothing. Smoothing a volume signal does not fix its frequency problem — but it does stop the bleeding. The Chaikin Oscillator is the only volume trend rule in the lab whose net return is not negative.
What this does NOT prove
- The A/D line's EOD default uses the close-to-close range; the Chaikin Oscillator is sensitive to that definition and to the 3/10 smoothing pair. 563 trades is the binding constraint, not the smoothing.
- "First net-positive volume rule" is a ranking, not an endorsement — +1.37% at Sharpe 0.21 is a coin flip with extra steps.
- One pair, one year, one regime.
Code
from backtest_base import fetch, backtest_signal, metrics
from strategy import sig_chaikin_osc

df = fetch("BTCUSDT", "binance", "2023-01-01", "2023-12-31", "1h")
signal = sig_chaikin_osc(df, fast=3, slow=10)

res = backtest_signal(df, signal, cost_per_leg=0.0005, funding_per_bar=0.0000125)
print(metrics(res, 8760))
Reproduce it
cd blog-drafts/scripts
python gen_post_assets.py --ids 61
Data: Binance public API, hourly OHLCV, 8,735 bars. Tables above reproduce exactly from this command.
This is a backtest on historical data, not investment advice. Past performance does not predict future results.