Accumulation/Distribution Line Backtest on BTC/USDT: the Volume Family's Fourth Strike
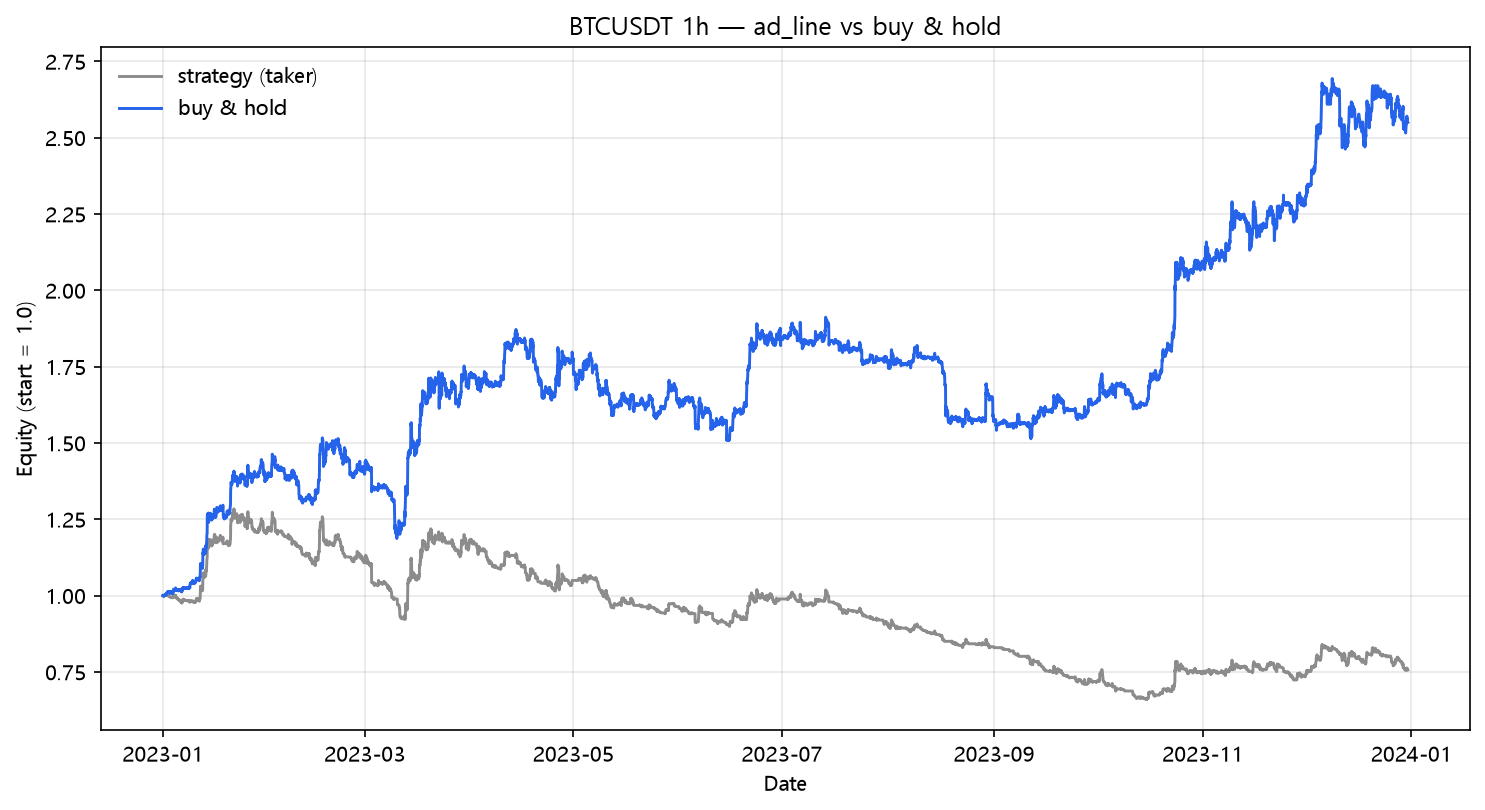
The A/D Line on real hourly BTC/USDT 2023: +59.88% naive, -24.35% after fees and funding, -97.65% at 25bp across 694 trades. The volume family is now 0-for-4 — OBV, Force Index, CMF, and now A/D.
Accumulation/Distribution Line Backtest on BTC/USDT (2023, hourly, real fees)
The Accumulation/Distribution Line is Marc Chaikin's improvement on OBV: instead of counting every up-bar as one unit of volume, it weights volume by where the close sits inside the bar's range. It is the more sophisticated sibling of the indicator that already failed this lab in post 16. The sophistication didn't help. The A/D Line is the volume family's fourth strike. Strategy Lab #51.
The setup
A/D = cumulative sum of (close-location-value × volume), where CLV = ((close − low) − (high − close)) / (high − low). Long when the A/D line is above its own 20-bar EMA. Same engine, same costs.
Results
| Strategy | Category | Total return | CAGR | MaxDD | Sharpe | Trades |
|---|---|---|---|---|---|---|
| ad_line | volume | -24.35% | -24.35% | -48.60% | -0.65 | 694 |
The fee bill
| Scenario | Cost/leg | Total return | MaxDD | Sharpe | Trades | |---|---:|---:|---:|---:|---:|---:| | naive (zero cost) | 0.00% | +59.88% | -22.78% | 1.55 | 694 | | taker fee 0.05%/leg | 0.05% | -20.10% | -46.65% | -0.49 | 694 | | + funding 0.01%/8h | 0.05% | -24.35% | -48.60% | -0.65 | 694 | | + slippage 10bp/leg | 0.15% | -81.13% | -84.17% | -4.67 | 694 | | + slippage 25bp/leg | 0.30% | -97.65% | -97.80% | -10.35 | 694 |
694 trades means the A/D line crossed its EMA every few hours, all year. The gross +59.88% — the third consecutive volume rule with a credible gross number — turned into a -24.35% net loss and a -48.6% drawdown that is worse than holding's -21.7%. The strategy wasn't wrong about the trend; it was wrong about how often it needed to be reminded of the trend.
The volume family scoreboard
| Strategy | Post | Trades | Naive | Fees+funding | 25bp |
|---|---|---|---|---|---|
| MFI reversion | 29 | 36 | +18.87% | +9.01% | -8.98% |
| Force Index | 33 | 507 | +43.34% | -17.50% | -93.47% |
| CMF | 36 | 557 | +84.53% | -0.00% | -93.84% |
| OBV | 16 | 734 | +63.78% | -24.95% | -98.10% |
| A/D Line (this) | — | 694 | +59.88% | -24.35% | -97.65% |
Four trend-following volume rules, four failures, all in the -0.00% to -25% net band, all trading 500+ times. The only volume strategy that survived — MFI — is the reversion one that traded 36 times. The conclusion from post 36 now has four data points instead of two: volume-weighted momentum signals on hourly crypto flip their sign far too often to carry any net edge.
What this does NOT prove
- A/D as a divergence tool (price makes a new high, A/D doesn't) is the classic professional use and is a completely different test from the trend-follow version here.
- Daily bars would halve the trade count; the lab's consistent finding says slower is better, but nothing here proves it for A/D specifically.
- One pair, one year, one regime.
Code
from backtest_base import fetch, backtest_signal, metrics
from strategy import sig_ad_line

df = fetch("BTCUSDT", "binance", "2023-01-01", "2023-12-31", "1h")
signal = sig_ad_line(df, span=20)

res = backtest_signal(df, signal, cost_per_leg=0.0005, funding_per_bar=0.0000125)
print(metrics(res, 8760))
Reproduce it
cd blog-drafts/scripts
python gen_post_assets.py --ids 51
Data: Binance public API, hourly OHLCV, 8,735 bars. Tables above reproduce exactly from this command.
This is a backtest on historical data, not investment advice. Past performance does not predict future results.