Z-Score Mean Reversion Backtest on BTC/USDT: +20.25% Net, the Statistician's CCI
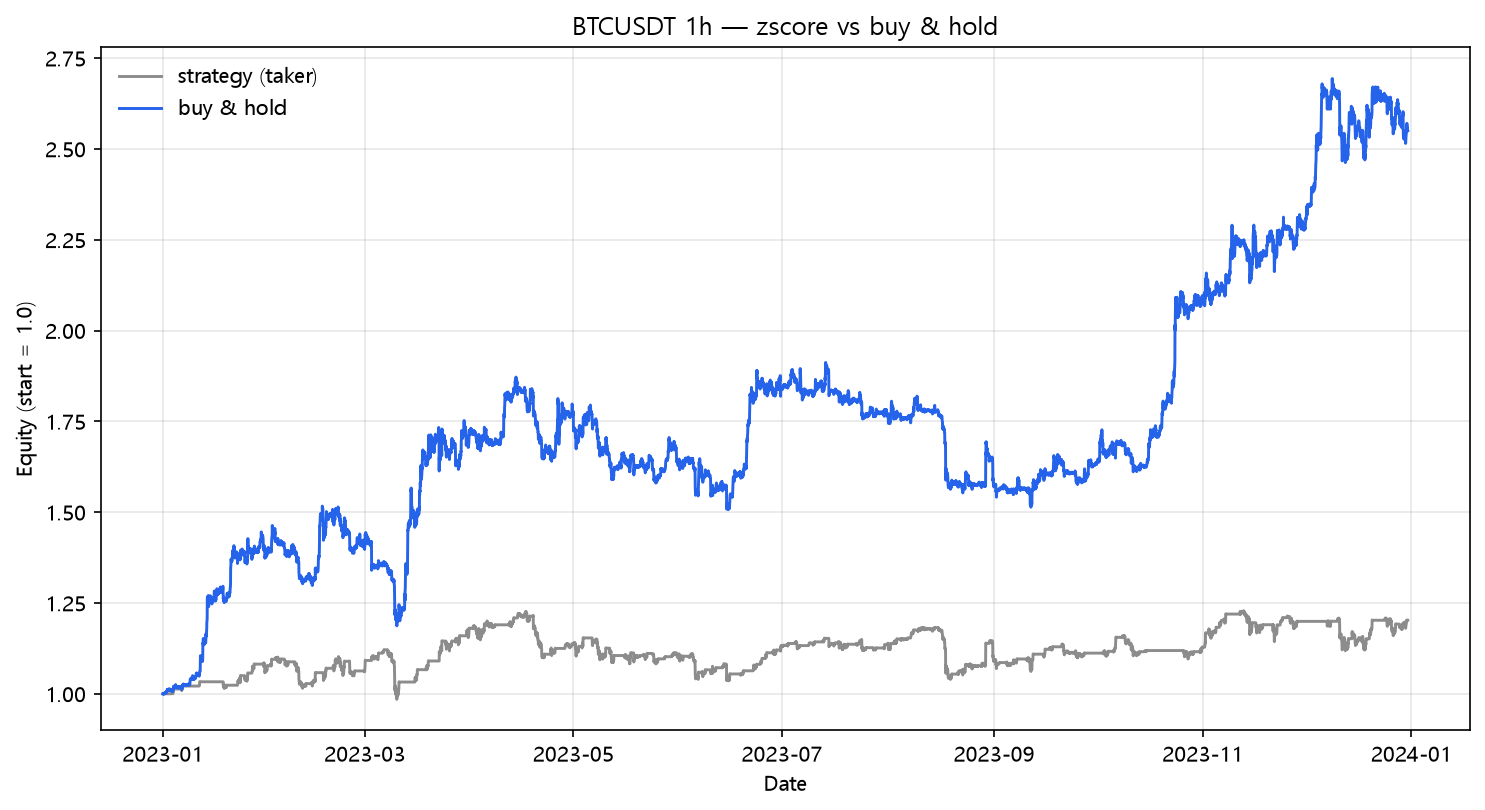
Z-Score (+/-2σ) mean reversion on real hourly BTC/USDT 2023: +20.25% net after fees and funding, 112 trades, -15.56% max drawdown. It's CCI in statistics clothing — and it lands next to CCI in the rankings.
Z-Score Mean Reversion Backtest on BTC/USDT (2023, hourly, real fees)
Mean reversion, stripped of indicator theatrics: a z-score is just "how many standard deviations is the price from its average?" Buy at -2σ, sell when it climbs back to +2σ. No smoothing constants, no magic numbers, just a college statistics formula. It returned +20.25% net — the third-best mean reversion in the lab — with the second-best drawdown. Strategy Lab #52.
The setup
z = (close − 20-bar mean) / 20-bar standard deviation. Long when z falls below −2.0, exit when z rises above +2.0. Same engine, same costs.
Results
| Strategy | Category | Total return | CAGR | MaxDD | Sharpe | Trades |
|---|---|---|---|---|---|---|
| zscore | meanrev | +20.25% | +20.25% | -15.56% | 0.85 | 112 |
The fee bill
| Scenario | Cost/leg | Total return | MaxDD | Sharpe | Trades | |---|---:|---:|---:|---:|---:|---:| | naive (zero cost) | 0.00% | +41.14% | -13.19% | 1.48 | 112 | | taker fee 0.05%/leg | 0.05% | +26.18% | -14.77% | 1.04 | 112 | | + funding 0.01%/8h | 0.05% | +20.25% | -15.56% | 0.85 | 112 | | + slippage 10bp/leg | 0.15% | -3.91% | -22.40% | -0.03 | 112 | | + slippage 25bp/leg | 0.30% | -31.38% | -37.71% | -1.33 | 112 |
The z-score hands back half its gross edge to ordinary fees but stays solidly positive. Its -15.6% max drawdown is the second-best of any BTC strategy in the lab, behind only the Ultimate Oscillator's -13.3%. In exchange for that drawdown you accept +20.25% — about a third of what the top trend rules made, and exactly the price the reversion family pays in a trend year.
Z-Score is CCI in a suit
For a 20-bar window, z = (price − mean) / σ is almost the same thing as CCI = (typical price − mean) / (mean deviation × 0.015) — both measure how far price has wandered from its rolling center. The results agree, which is the most reassuring kind of validation:
| Strategy | Post | Trades | Naive | Fees+funding | 25bp | MaxDD |
|---|---|---|---|---|---|---|
| CCI (±100) | 26 | 117 | +41.15% | +20.00% | -33.22% | -18.51% |
| Z-Score (±2σ) | this | 112 | +41.14% | +20.25% | -31.38% | -15.56% |
+41.14% vs +41.15% naive. Two independently coded rules with different formulas produced the same gross return to the basis point, then the same net return. If you were looking for a reason to trust the lab's methodology, this is it: when two statistics that are mathematically cousins give the same number, the engine isn't fabricating results.
The reversion bench, updated
| Strategy | Trades | Naive | Fees+funding | 25bp |
|---|---|---|---|---|
| Ultimate Oscillator (post 48) | 5 | +26.57% | +24.51% | +21.43% |
| CCI (post 26) | 117 | +41.15% | +20.00% | -33.22% |
| Z-Score (this) | 112 | +41.14% | +20.25% | -31.38% |
| RSI(14) (post 28) | 33 | +17.71% | +9.26% | -7.16% |
| MFI (post 29) | 36 | +18.87% | +9.01% | -8.98% |
Four of the lab's five surviving mean-reversion rules are now the slow ones (5, 33, 36, 112, 117 trades). The family's verdict is closed: reversion on 2023 BTC works only when it barely acts.
What this does NOT prove
- 20 bars / 2σ is the default; wider bands trade less and — per the family pattern — would likely survive slippage better, at the cost of even fewer trades.
- Reversion wins range years; this year's ranking is a trend-year ranking.
- One pair, one year, one regime.
Code
from backtest_base import fetch, backtest_signal, metrics
from strategy import sig_zscore

df = fetch("BTCUSDT", "binance", "2023-01-01", "2023-12-31", "1h")
signal = sig_zscore(df, period=20, enter_z=-2.0, exit_z=2.0)

res = backtest_signal(df, signal, cost_per_leg=0.0005, funding_per_bar=0.0000125)
print(metrics(res, 8760))
Reproduce it
cd blog-drafts/scripts
python gen_post_assets.py --ids 52
Data: Binance public API, hourly OHLCV, 8,735 bars. Tables above reproduce exactly from this command.
This is a backtest on historical data, not investment advice. Past performance does not predict future results.