Williams %R Backtest on BTC/USDT: The Oversold Staple That Turned a Green Year Red
Williams %R mean reversion on real hourly BTC/USDT 2023: +7.40% naive, -15.19% with fees and funding, -66.76% at 25bp. 65.2% win rate still lost money in the strongest bull tape of the decade.
Williams %R Backtest on BTC/USDT (2023, hourly, real fees)
Larry Williams published %R in 1973, and it's the indicator every trading course teaches before the lunch break: how far the close sits from the N-bar high, scaled so −100 is "maximum oversold" and 0 is "at the highs." Buy below −80, sell above −20. I coded it exactly that way, ran a year of hourly BTC, and the strategy lost money in a year when the underlying more than doubled. Not slightly — -15.19% after fees and funding, on the same data where buying and holding made +154.94%. I keep that table around because it's the best antidote I know to the word "oversold." Strategy Lab #27.
Results
| Strategy | Category | Total return | CAGR | MaxDD | Sharpe | Trades |
|---|---|---|---|---|---|---|
| williams_r | meanrev | -15.19% | -15.23% | -32.63% | -0.49 | 187 |
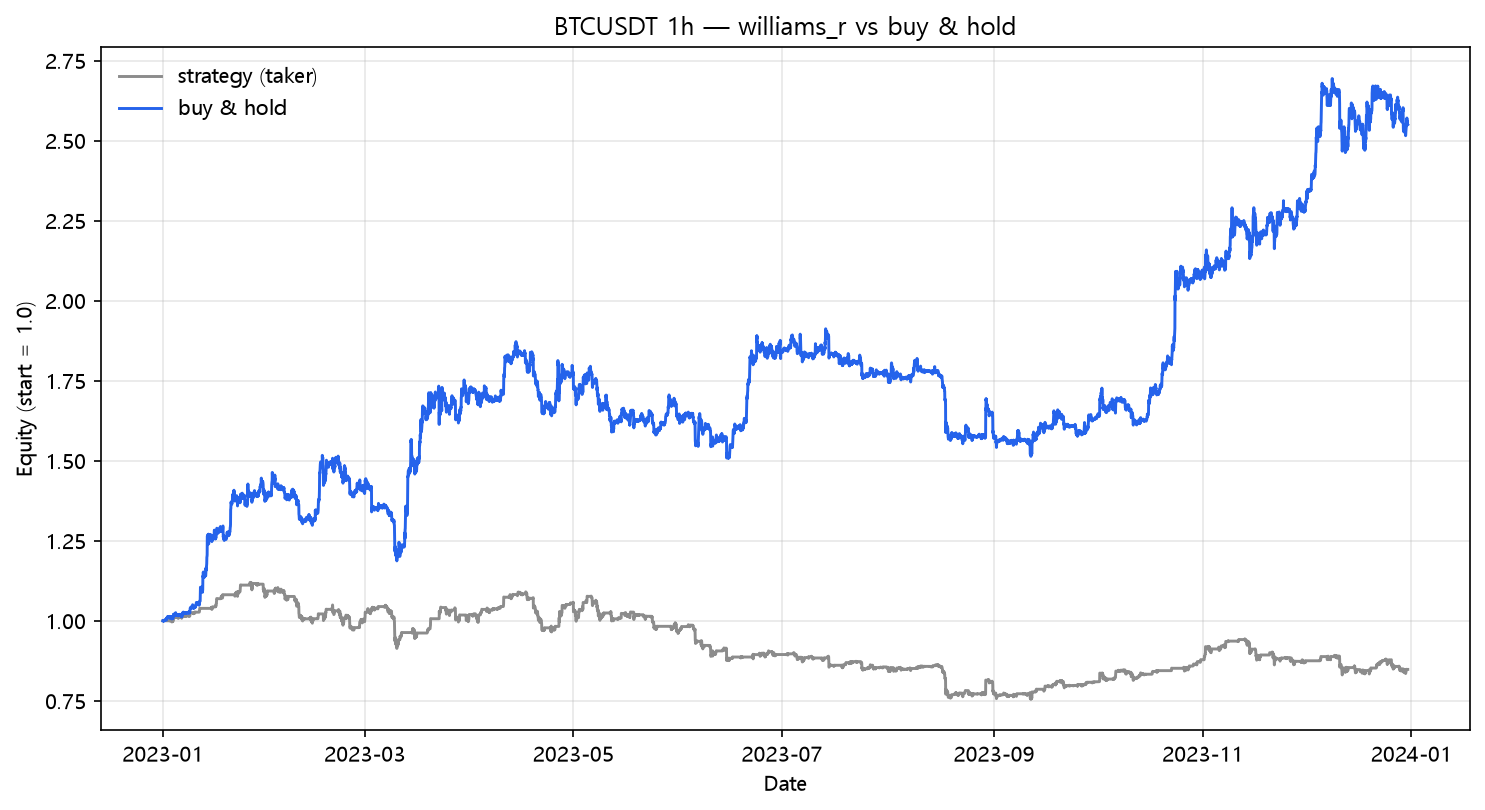
The naive number was +7.40% with a feeble Sharpe of 0.40. Add the standard cost stack and it's solidly negative. Win rate was 65.2% (122/187) — the second-highest in the lab — and it still lost money. When a strategy wins two-thirds of its trades and loses money, the distribution is telling you the losses are much bigger than the wins and the fee bill is picking up the difference.
The fee bill
| Scenario | Cost/leg | Total return | MaxDD | Sharpe | Trades | |---|---:|---:|---:|---:|---:|---:| | naive (zero cost) | 0.00% | +7.40% | -24.65% | 0.40 | 187 | | taker fee 0.05%/leg | 0.05% | -10.92% | -30.33% | -0.30 | 187 | | + funding 0.01%/8h | 0.05% | -15.19% | -32.63% | -0.49 | 187 | | + slippage 10bp/leg | 0.15% | -41.68% | -47.26% | -1.89 | 187 | | + slippage 25bp/leg | 0.30% | -66.76% | -68.65% | -3.94 | 187 |
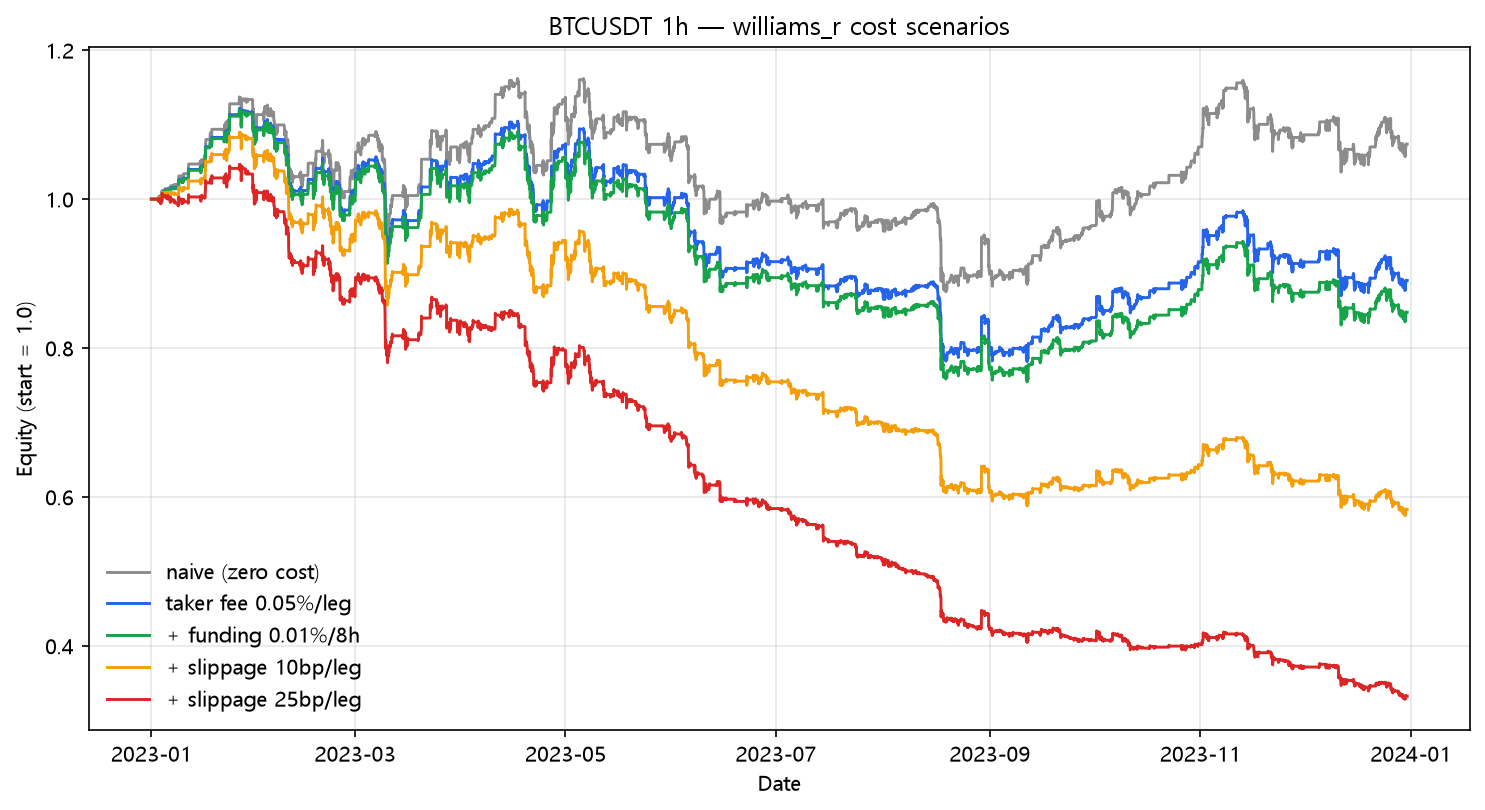
+7.40% → -66.76%. The reason %R loses in a bull year is structural: a mean-reversion rule that buys "dips" spends a bull market short the trend. Every pullback in an uptrend is a dip you buy, the bounce is smaller than the continuation, and the −20 exit sells into strength far too early. It's the mirror image of the breakout strategies (posts 13–14): those buy strength late, this buys weakness early, and in 2023 weakness was always the wrong side. There's no parameter fix for being on the wrong side of the regime.
What this does NOT prove
- %R reversion is a range strategy. On the sideways quarters of this same year it likely had good patches — the annual total hides them.
- −80/−20 is the textbook pair; stricter bands (−90/−10) would trade less, but the regime problem remains.
- The lesson generalizes across the reversion family (RSI(2) post 08, stochastic post 10, CCI post 26): on a year this directional, every "buy the dip" rule is a standing order against the tape.
Code
from backtest_base import fetch, backtest_signal, metrics

df = fetch("BTCUSDT", "binance", "2023-01-01", "2023-12-31", "1h")
hh = df["high"].rolling(14).max()
ll = df["low"].rolling(14).min()
wr = -100.0 * (hh - df["close"]) / (hh - ll).replace(0.0, np.nan)

enter = (wr < -80.0).to_numpy()
exit_ = (wr > -20.0).to_numpy()
position = np.zeros(len(df), dtype=bool)
held = False
for i in range(len(df)):
    if not held and enter[i]:
        held = True
    elif held and exit_[i]:
        held = False
    position[i] = held

signal = pd.Series(position, index=df.index)
res = backtest_signal(df, signal, cost_per_leg=0.0005,
                      funding_per_bar=0.0001 / 8.0)
print(metrics(res, 8760))
Reproduce it
cd blog-drafts/scripts
python backtest_base.py --strategy williams_r --symbol BTCUSDT --interval 1h \
    --start 2023-01-01 --end 2023-12-31 --fee 0.0005 --funding 0.0000125
Data: Binance public API, hourly OHLCV, 8,735 bars. The tables above reproduce exactly from this command.
This is a backtest on historical data, not investment advice. Past performance does not predict future results.