Elder Ray Backtest on BTC/USDT: Bull Power, Gross +86.25%, Net -8.13%
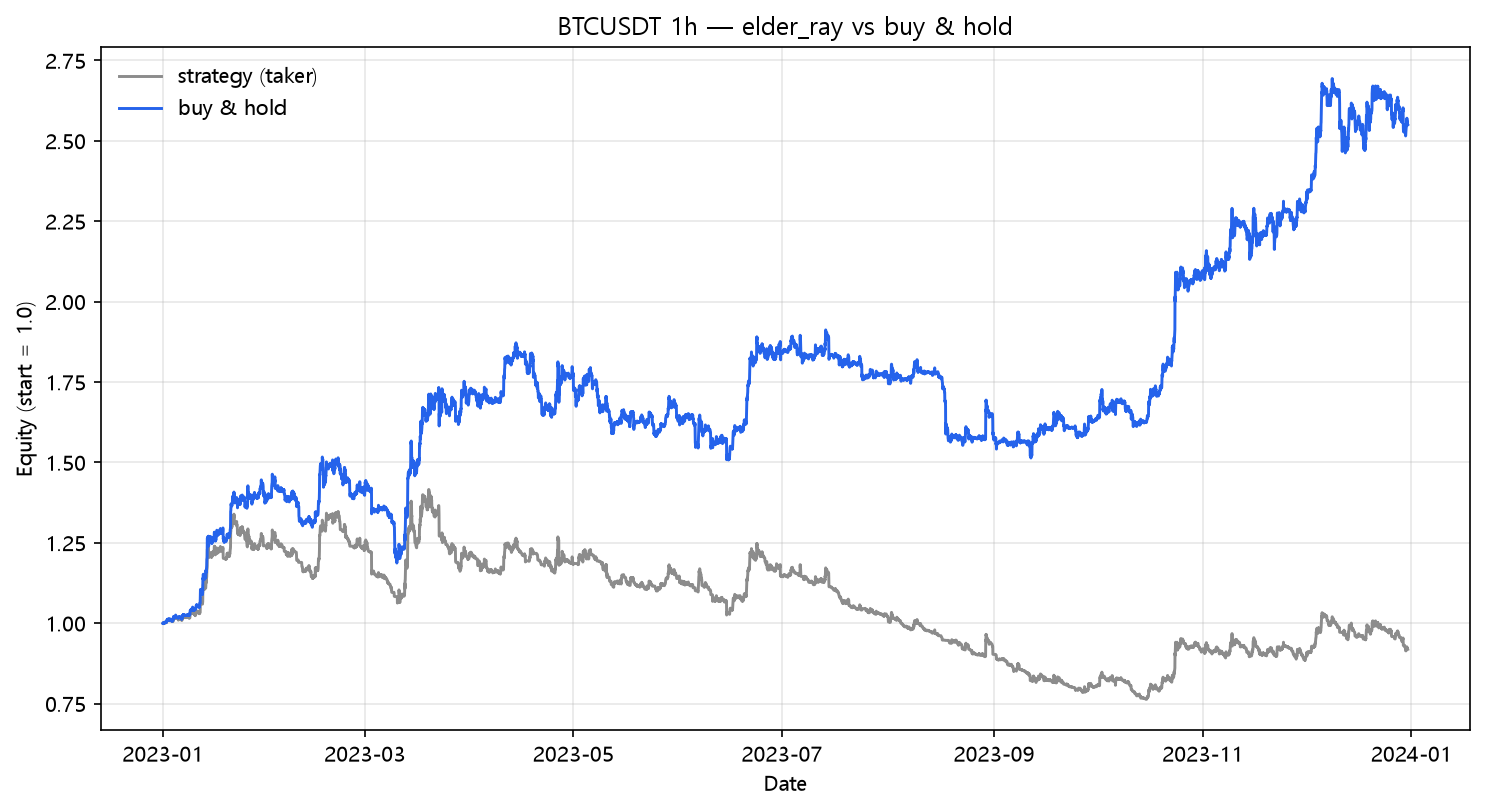
Elder Ray's Bull Power on real hourly BTC/USDT 2023: +86.25% naive collapses to -8.13% after fees and funding and -96.19% at 25bp. 636 trades of buying high, and the deepest drawdown in the momentum family.
Elder Ray Backtest on BTC/USDT (2023, hourly, real fees)
Elder Ray, from Alexander Elder's Trading for a Living, splits each bar into two forces: Bull Power (high − EMA13) and Bear Power (low − EMA13). The trading idea is simple — when bulls are in charge, buy and stay long. This lab tested it as a pure long rule. The gross year was excellent. The net year was a loss, and the drawdown while getting there was the worst in the momentum family. Strategy Lab #50.
The setup
Long when Bull Power = high − EMA(13) > 0, flat otherwise. Same engine, same costs.
Results
| Strategy | Category | Total return | CAGR | MaxDD | Sharpe | Trades |
|---|---|---|---|---|---|---|
| elder_ray | momentum | -8.13% | -8.13% | -46.10% | -0.04 | 636 |
The fee bill
| Scenario | Cost/leg | Total return | MaxDD | Sharpe | Trades | |---|---:|---:|---:|---:|---:|---:| | naive (zero cost) | 0.00% | +86.25% | -21.36% | 1.87 | 636 | | taker fee 0.05%/leg | 0.05% | -1.36% | -43.96% | 0.15 | 636 | | + funding 0.01%/8h | 0.05% | -8.13% | -46.10% | -0.04 | 636 | | + slippage 10bp/leg | 0.15% | -74.26% | -79.93% | -3.45 | 636 | | + slippage 25bp/leg | 0.30% | -96.19% | -96.81% | -8.33 | 636 |
+86.25% → -8.13% → -96.19%. The single fee column tells the whole story: 0.05% per leg, 1,272 legs, and a strategy that made +86 points gross is down 8. With slippage, the account goes to zero and keeps going. Elder Ray's gross Sharpe (1.87) and max drawdown (-21.4%) look like a real system. The cost model exposes the truth: it spent the year long during the good hours and also long during every shakeout, paying a round trip on each one.
Why the naive curve lies
Bull Power > 0 is satisfied almost any time the market isn't actively crashing — hourly highs sit above a 13-EMA most of the time. So the rule is "long most of the year, with hundreds of quick exits and re-entries during dips." In 2023 that's a leveraged buy & hold that trades 636 times instead of holding, and it converts holding's +154.94% into a loss. The gross number is the bait; the net number is the product.
The momentum losers, grouped
| Strategy | Trades | Naive | Fees+funding | 25bp |
|---|---|---|---|---|
| Elder Ray (this) | 636 | +86.25% | -8.13% | -96.19% |
| CMO (post 47) | 656 | +98.99% | -1.55% | -96.31% |
| ROC (post 31) | 700 | +97.20% | -6.61% | -97.19% |
| Momentum (post 35) | 785 | +74.31% | -24.00% | -98.51% |
| Force Index (post 33) | 507 | +43.34% | -17.50% | -93.47% |
Every sign-flipping momentum rule that traded 500+ times ended between -1.55% and -24.00%. Elder Ray is the entry with the prettiest gross curve and the worst net — the perfect poster child for why this lab runs every strategy through the same fee engine.
What this does NOT prove
- Elder Ray was designed to be used with a trend filter and Bear Power confirmation, not as a standalone long trigger. That composed version is untested here.
- The long rule here ignores Elder's own recommendation to trade in the direction of the 13-EMA slope; that filter would trade less.
- One pair, one year, one regime.
Code
from backtest_base import fetch, backtest_signal, metrics
from strategy import sig_elder_ray

df = fetch("BTCUSDT", "binance", "2023-01-01", "2023-12-31", "1h")
signal = sig_elder_ray(df, period=13)

res = backtest_signal(df, signal, cost_per_leg=0.0005, funding_per_bar=0.0000125)
print(metrics(res, 8760))
Reproduce it
cd blog-drafts/scripts
python gen_post_assets.py --ids 50
Data: Binance public API, hourly OHLCV, 8,735 bars. Tables above reproduce exactly from this command.
This is a backtest on historical data, not investment advice. Past performance does not predict future results.