Donchian Slow Turtle Backtest on BTC/USDT: 55/20, the Original, +36.25% Net
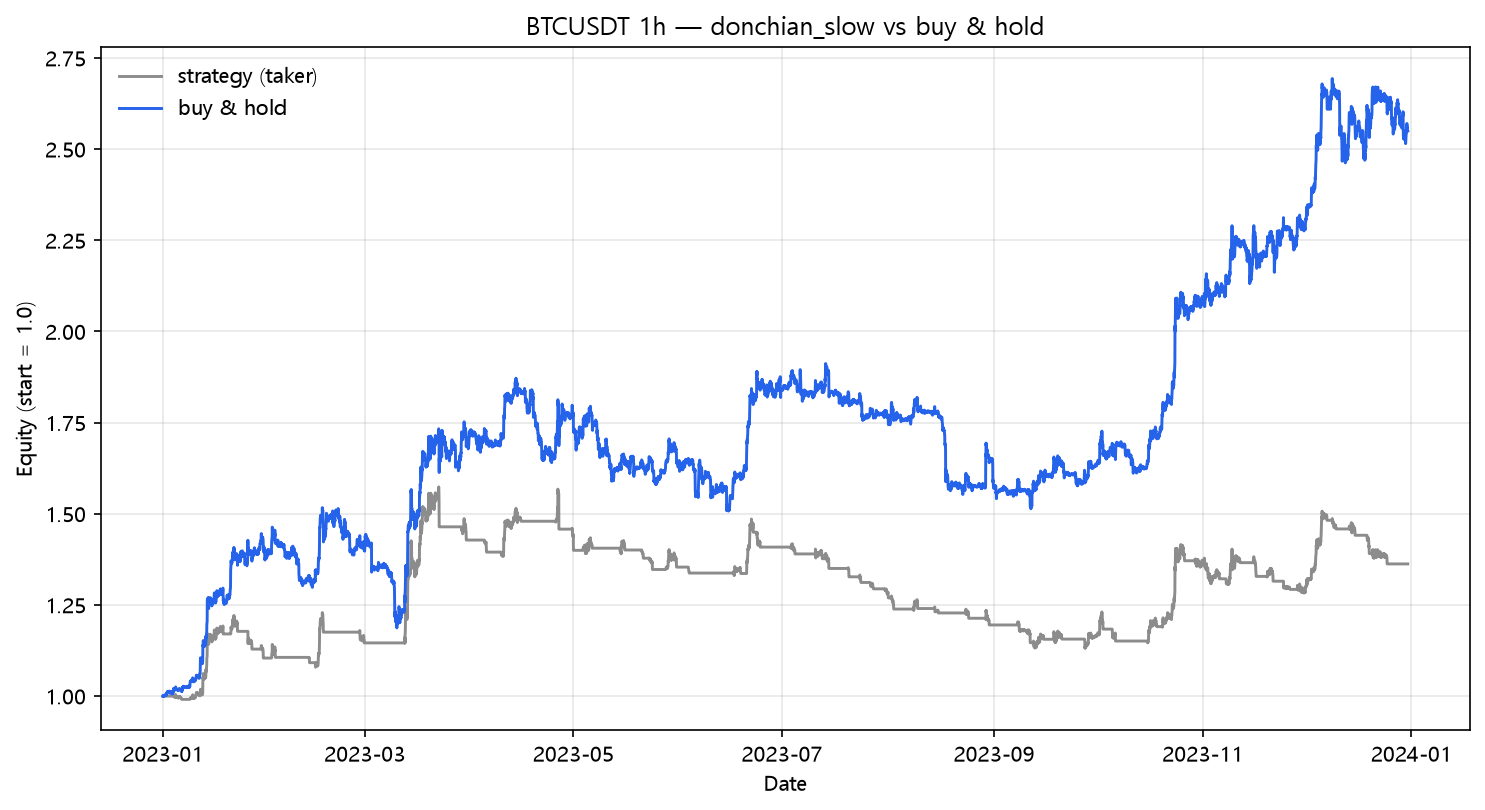
The original Turtle entry (55-bar high breakout) with the 20-bar exit on real hourly BTC/USDT 2023: +36.25% net, +3.44% even at 25bp, 55 trades. Slower than post 14's Turtle — and strictly better in every cost scenario.
Donchian Slow Turtle Backtest on BTC/USDT (2023, hourly, real fees)
Post 14 tested the "fast" Turtle — the 20-bar entry breakout. This is the original Turtle entry that Richard Dennis and William Eckhardt actually traded: buy a new 55-day high, sell on a 20-day low. On 2023 BTC it beat its own faster sibling in every cost scenario, which is exactly what the lab's frequency finding predicts. Strategy Lab #57.
The setup
Long when close closes above the highest high of the previous 55 bars; exit when close closes below the lowest low of the previous 20 bars. Long-only, same engine, same costs.
Results
| Strategy | Category | Total return | CAGR | MaxDD | Sharpe | Trades |
|---|---|---|---|---|---|---|
| donchian_slow | breakout | +36.25% | +36.25% | -28.14% | 1.22 | 55 |
The fee bill
| Scenario | Cost/leg | Total return | MaxDD | Sharpe | Trades | |---|---:|---:|---:|---:|---:|---:| | naive (zero cost) | 0.00% | +49.23% | -25.40% | 1.54 | 55 | | taker fee 0.05%/leg | 0.05% | +41.25% | -27.27% | 1.35 | 55 | | + funding 0.01%/8h | 0.05% | +36.25% | -28.14% | 1.22 | 55 | | + slippage 10bp/leg | 0.15% | +22.04% | -32.33% | 0.84 | 55 | | + slippage 25bp/leg | 0.30% | +3.44% | -38.16% | 0.26 | 55 |
+3.44% even at 25bp. The slow Turtle joins the short list of strategies (now six strong) that survive a 0.30% cost stack. Fifty-five trades is the sweet spot this lab has been triangulating all series: rare enough that 25bp is 16 points of annual cost, frequent enough to actually catch the year's trend. The 55-bar entry filters out the false breakouts that the fast Turtle's 20-bar entry loved to buy.
The Turtle sibling fight
| Version | Trades | Naive | Fees+funding | 25bp | MaxDD | |---|---:|---:|---:|---:|---:|---:| | Fast 20/20 (post 14) | 91 | +44.11% | +24.24% | -21.04% | -41.90% | | Slow 55/20 (this) | 55 | +49.23% | +36.25% | +3.44% | -28.14% |
The slow version trades 36 fewer times, makes more gross and more net, and halves the drawdown. The 55-bar breakout is not just cheaper — it's a better filter. This is the cleanest within-family control the breakout group has produced: same channel logic, slower entry, strictly better.
The breakout family, restated
| Strategy | Post | Trades | Naive | Fees+funding | 25bp |
|---|---|---|---|---|---|
| EMA envelope | 24 | 22 | +96.69% | +80.99% | +62.11% |
| SMA envelope | 56 | 29 | +54.79% | +41.44% | +22.32% |
| Donchian slow (this) | — | 55 | +49.23% | +36.25% | +3.44% |
| Donchian fast | 14 | 91 | +44.11% | +24.24% | -21.04% |
| Keltner | 13 | 112 | +39.22% | +21.60% | -30.61% |
| BB breakout | 49 | 188 | +60.55% | +29.03% | -49.56% |
The family now ranks almost perfectly by trade count. Donchian slow is the ranking's best evidence that deliberately slowing down an entry is a legitimate alpha source on its own.
What this does NOT prove
- The real Turtle system pyramided (added size every 0.5 ATR) and traded short side too; this is the plain long-only entry/exit skeleton.
- 55/20 is one point in a large parameter space; the fast version's worse result is consistent with the lab's pattern, not proof of a global optimum.
- One pair, one year, one regime.
Code
from backtest_base import fetch, backtest_signal, metrics
from strategy import sig_donchian_slow

df = fetch("BTCUSDT", "binance", "2023-01-01", "2023-12-31", "1h")
signal = sig_donchian_slow(df, entry_period=55, exit_period=20)

res = backtest_signal(df, signal, cost_per_leg=0.0005, funding_per_bar=0.0000125)
print(metrics(res, 8760))
Reproduce it
cd blog-drafts/scripts
python gen_post_assets.py --ids 57
Data: Binance public API, hourly OHLCV, 8,735 bars. Tables above reproduce exactly from this command.
This is a backtest on historical data, not investment advice. Past performance does not predict future results.